Japan Markets ViewReading Future Earnings Revisions based on Monthly Sales & Business Activity Data
Oct 10, 2023
Summary
- Monthly Sales & Business Activity Data Provided by QUICK
QUICK collects, compiles, and provides data on monthly sales, number of stores, number of customers, etc. that companies publish on their corporate websites. - Reading Future Earnings Revisions Using Monthly Sales & Business Activity Data
A statistical model using QUICK’s Monthly Sales & Business Activity Data allows for anticipating earnings revisions by companies.
Case Study 1: Railway business
Case Study 2: Restaurant business
Introduction
This article examines the effectiveness of the Monthly Sales & Business Activity Data provided by QUICK in anticipating full-year sales. The Monthly Sales & Business Activity Data is compiled by QUICK to provide business or management information, which is not available in earnings statements, based on the information disclosed by companies on their web pages.
Using this data, we constructed a statistical model to predict full-year sales for each indicator. In this article, we compared the predictive values based on this model with the expected sales figures announced by the companies to examine the predictability of earnings revisions during the fiscal year. Two case studies were conducted here using the Monthly Sales & Business Activity Data from October 2016 to April 2023.
Case Study 1
Keikyu Corporation (Keikyu, 9006) reports monthly sales figures for its railroad and supermarket businesses. Here, we take an example of forecasting full-year sales for Keikyu’s railway business/passenger revenue/commuter (in millions of JPY).
Company: Keikyu Corporation (9006)
Fiscal Year: Years ending March 2021, 2022 and 2023
Forecasting indicators: Railway business/ Passenger revenue/ Commuter (in millions of JPY)
Since Keikyu’s fiscal year ends in March, financial results are usually disclosed in May, and forecasts for the next fiscal year are revealed in its explanatory materials. In this article, the forecast starts in May to explore the possibility of earnings revisions by focusing on the difference between the model’s predictive values and the company’s forecasts. Keikyu’s monthly sales figures are announced with a one-month delay. Therefore, as of May, actual sales up to April are available, and the forecast model is built based on this data.
Looking at Figure 1, for the fiscal year ending March 2023, the constructed model predicts full-year sales fairly accurately starting in June 2022. Comparing the model’s predictive values with the company’s forecasts, the latter were consistently larger by a little more than JPY500 mn through October 2022. They were actually revised downward in conjunction with the Q2 earnings announcement. Even that revised forecast value is larger than that of the model’s predictive value. In fact, Keikyu failed to meet its forecast as indicated by the model’s predictive value. In this case study, the model accurately predicted full-year sales earlier in the fiscal year. The model not only indicated a potential downward revision based on the magnitude of the deviation from the company’s forecast, but also predicted the company’s failure to achieve its forecast.
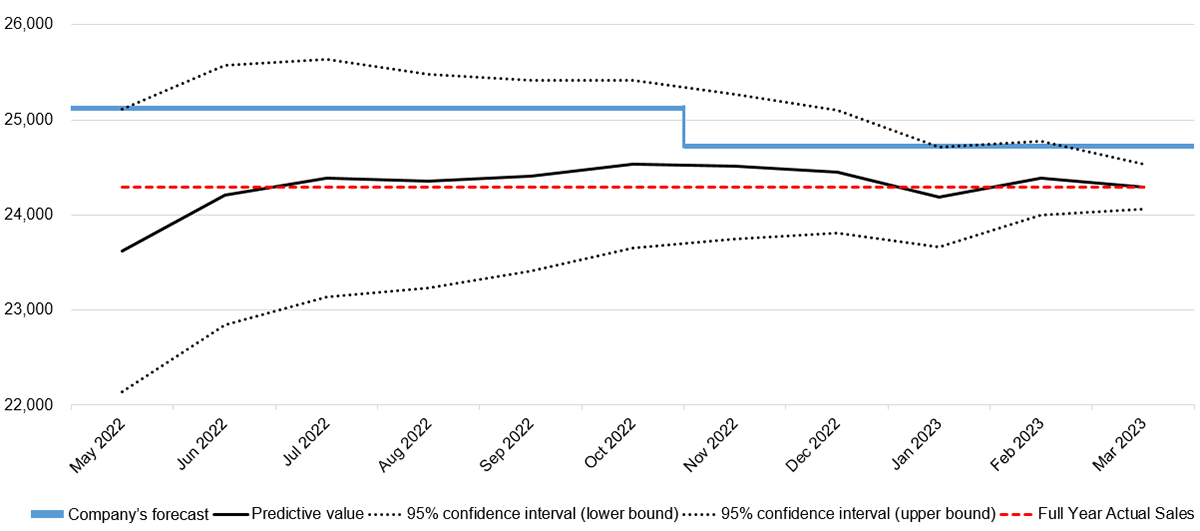
Figure 1: Keikyu’s Full-Year Sales Forecast Results for the Fiscal Year Ending March 2023 in Railway business/ Passenger revenue/ Commuter (in millions of JPY)
*Full-year sales in Railway business/ Passenger revenue/ Commuter (in millions of JPY) obtained from the Monthly Sales & Business Activity Data are not exactly the same as the sales revenue for the same indicators reported in the financial results materials. However, a comparison with sales revenue is made here since only a JPY4.8 mn difference is recognized on average over the past five years.
The fiscal year ending March 2021 was the period hit by the COVID-19 pandemic. For this reason, the company’s forecast was not provided in the full-year financial results materials in May, but was presented for the first time in the Q1 financial results announcement in August. Figure 2 clearly shows that the constructed model made relatively accurate predictions from August 2020, despite the irregular sales declines amid the COVID-19 pandemic. The company’s forecasts are considerably larger than the model’s predictive values. The model indicated that earnings would be revised downward significantly, which actually happened in November, three months after the Q2 results were announced. Even after the revision, the company’s forecast figures were larger. Another downward revision was made three months later in the Q3 results.
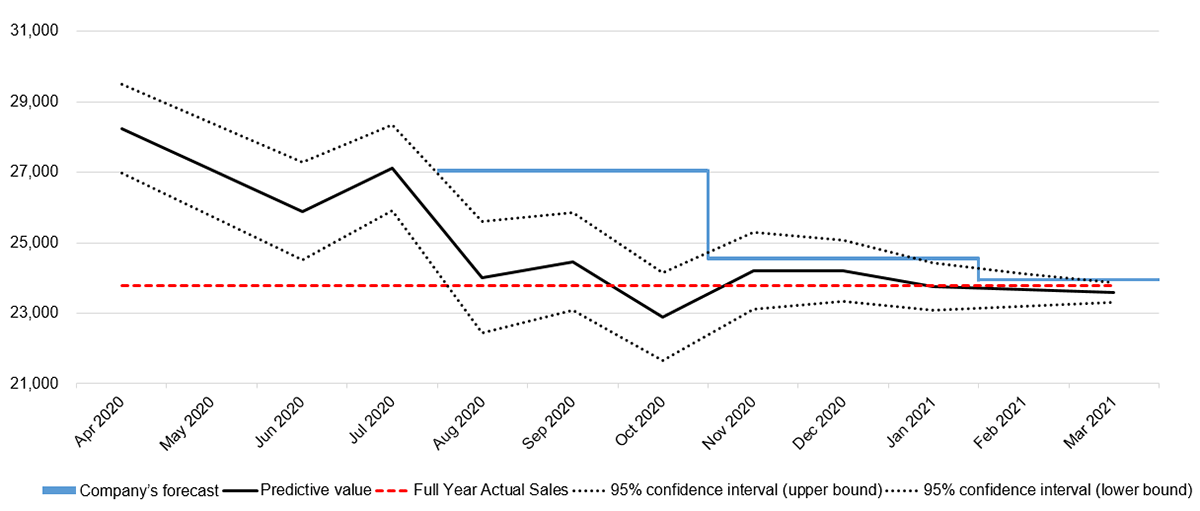
Figure 2: Keikyu’s Full-Year Sales Forecast Results for the Fiscal Year Ending March 2021 in Railway business/ Passenger revenue/ Commuter (in millions of JPY)
Figure 3 indicates that for the fiscal year ending March 2022, the model accurately forecasted full-year sales from August 2021.
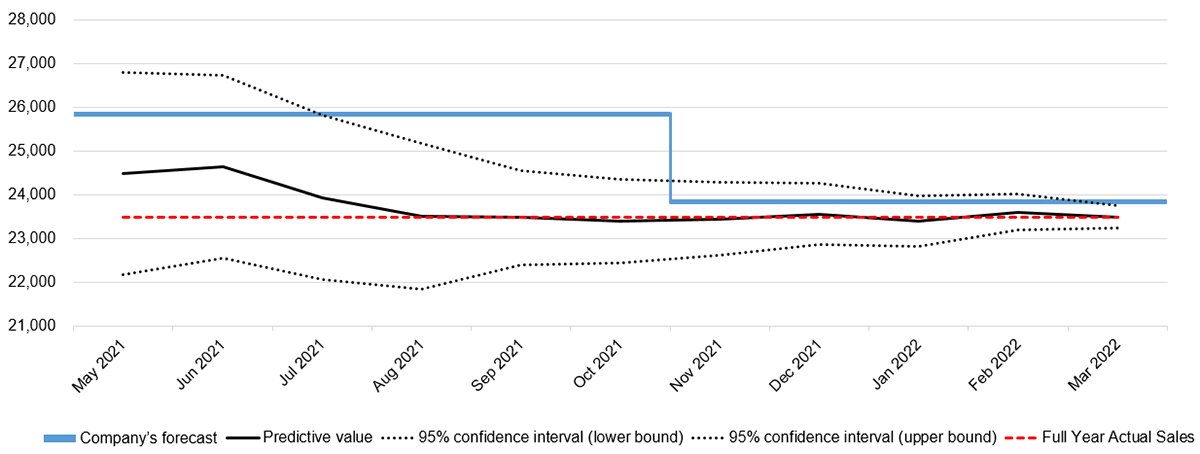
Figure 3: Keikyu’s Full-Year Sales Forecast Results for the Fiscal Year Ending March 2022 in Railway business/ Passenger revenue/ Commuter (in millions of JPY)
Case Study 2
Ichibanya, with its mainstay chain of curry specialty restaurants, reports the YoY ratio of its all restaurant monthly sales. Although it is assumed that full-year sales forecasts for the last three years have been difficult due to the COVID-19 pandemic, we take an example of domestic sales forecasting using the monthly data.
Company: Ichibanya (7630)
Fiscal Year: Years ending February 2021, 2022, and 2023
Forecasting indicators: Domestic sales
Figures 4 through 6 show the model generally forecasts reasonably well from around July in all years, even forecasts vary depending on the COVID-19-driven sharp decline in sales and the recovery speed. In the first half of the fiscal years ending February 2022 and 2023, in particular, the deviation between the model and the company’s forecast was large, suggesting a significant downward revision. In fact, when the Q2 results were announced in October, substantial downward revisions were made for both years. This example also indicates that the Monthly Sales & Business Activity Data allows for forecasting full-year sales with considerable accuracy, as well as predicting earnings revisions and achievement of full-year forecasts based on the degree of deviation from the company’s forecast.
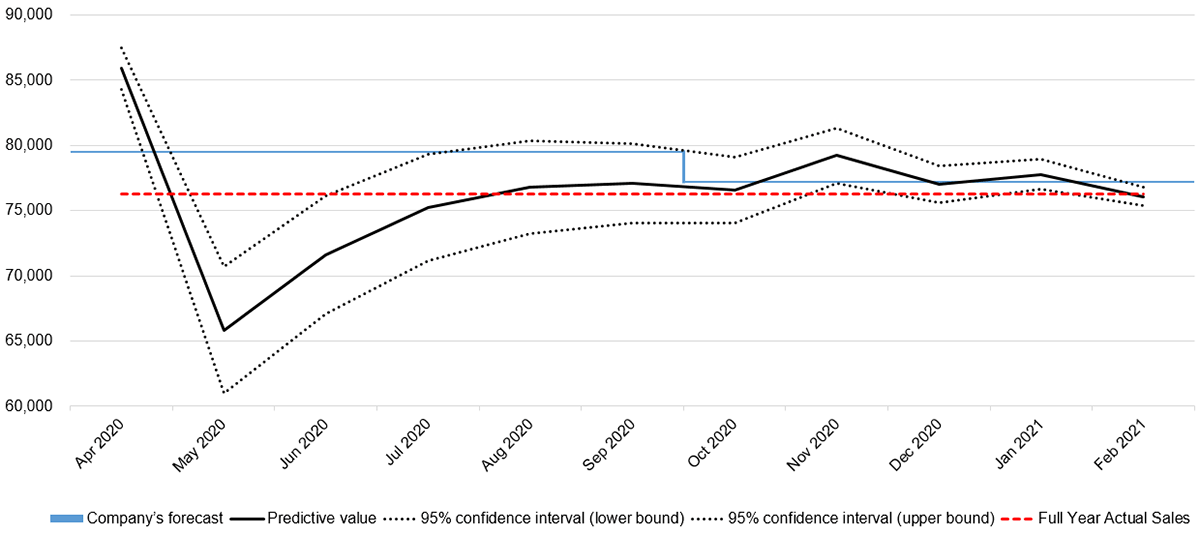
Figure 4: Ichibanya’s Full-Year Domestic Sales Forecast Results (in millions of JPY) for the Fiscal Year Ending February 2021
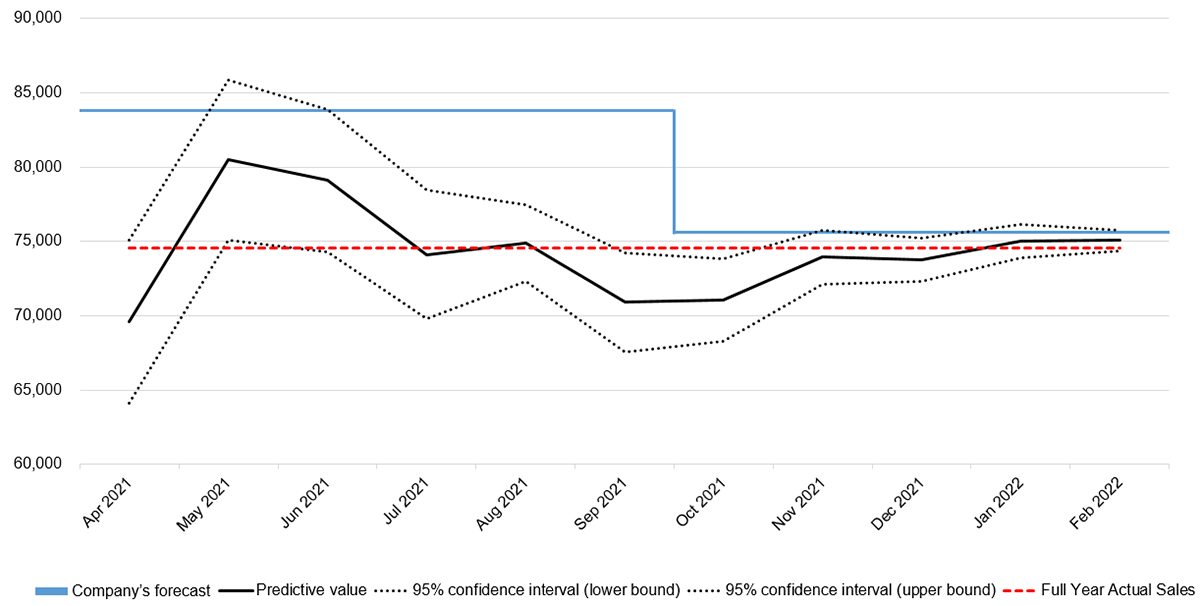
Figure 5: Ichibanya’s Full-Year Domestic Sales Forecast Results (in millions of JPY) for the Fiscal Year Ending February 2022
Figure 6: Ichibanya’s Full-Year Domestic Sales Forecast Results (in millions of JPY) for the Fiscal Year Ending February 2023
*Ichibanya has been reporting earnings revisions as needed, even if not at the time of the scheduled earnings announcements. However, the specific figures for the domestic sales forecast were provided only in the supplementary materials for the Q2 results briefing. Therefore, a comparison is made here solely with those forecasts.
Conclusion
In this article, we compared the predictive values based on the model constructed using the Monthly Sales & Business Activity Data with the company’s sales forecasts to examine the predictability of earnings revisions during the fiscal year. In the last three years, performance has been unstable due to the impact of COVID-19. However, the model is updated monthly, taking into account the most recent performance data. As a result, the model has proven to be stable in forecasting from early in the fiscal year, especially around the time of the Q1 earnings announcement, though it must have been difficult for the company to forecast at such a time. In addition, when there was a large discrepancy between the company’s forecast and the model’s predictive value, earnings revisions were made as suggested by the model. Moreover, the model determines the achievement status of the company’s forecast several months in advance. The case studies confirm that the use of the model to predict full-year sales constructed using the Monthly Sales & Business Activity Data enables the forecasting of earnings revisions and the achievement of the company’s full-year forecast.
Monthly Sales & Business Activity Data on QUICK Data Factory
https://corporate.quick.co.jp/data-factory/en/product/data010/
Follow us on LinkedIn to stay updated with Japan Markets.