Japan Markets ViewTrend-following Strategy Using NQN News
Oct 19, 2023
Summary
- QUICK provides data on NQN market news
QUICK provides data on Nikkei QUICK News, Inc. (NQN), which distributes breaking market news. - Evaluation of trend-following strategy investment performance
Based on the assumption that stock prices fluctuate in response to NQN news, we constructed an investment method to follow the stock price trend before and after news had been released, and we evaluated investment performance. - Investment performance exceeds the benchmark
All of the 10 stocks selected for investment outperformed the TOPIX return of -5.26% for the one-month investment period ending in December 2022.
Introduction
F-index, a data analysis consulting service provider in Japan, has conducted a case study on the distribution trends of news provided by Nikkei QUICK News (NQN News) and its use for stock investment. The assumption is that positive news will encourage stock buying, driving up the prices, while negative news will induce stock selling, driving down the prices. Under this assumption, if the stock price rises after the news is distributed, then the news is considered positive, and if the stock price declines after the distribution, then the news is considered negative. In this article, we examine this trend-following strategy, in which stocks were traded according to stock price changes before and after the news distribution.
Rules for the Trend-Following Strategy
- Rule 1: Cover news distributed during the trading session.
- Rule 2: In principle, set the investment decision period at one instance per hour and generate buy/sell signals according to the stock price trend during the time period of news distribution.
- Rule 3: When a buy/sell signal is generated, buy or sell the stock in question at the opening of the next trading session.
- Rule 4: Liquidate positions at the market closing of each day.
[Supplement to Rule 2]
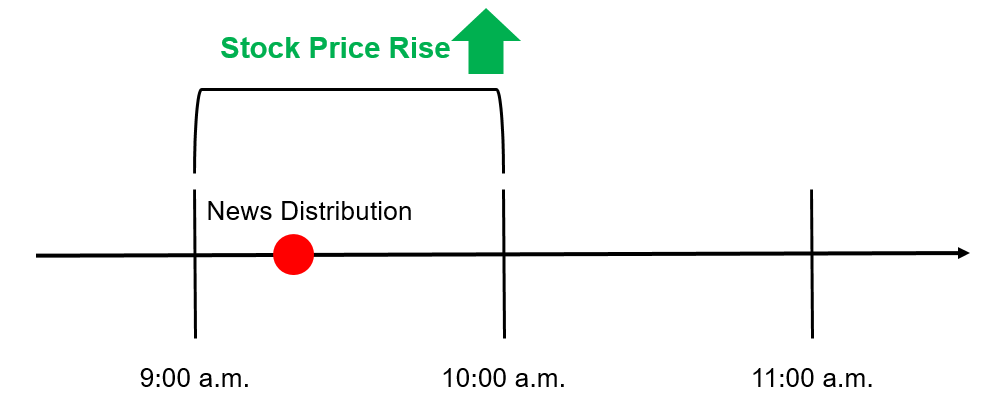
As shown in Figure 1, it was assumed that the news would be disseminated during one-hour period from 9:00 a.m. (i.e., from 09:00 a.m. to 09:59 a.m.). If the stock price rose during this time period, it was considered that a buy signal was generated. Even when multiple news items were distributed, a buy signal or a sell signal would be generated if the stock price rose or fell, respectively, during the same time period. As an exception, for the hours around the lunch break, the investment decision period was set from 11:00 a.m. to 11:30 a.m. and from 11:30 a.m. to 1:00 p.m. If a signal was generated, the stock would be traded at the afternoon session opening of 12:30 p.m. and 1:00 p.m., respectively. In order to eliminate positions at the afternoon session closing, news released during the time period of 2 p.m., just before the afternoon session closing, was not covered.
Figure 1: Generation of Buy Signal
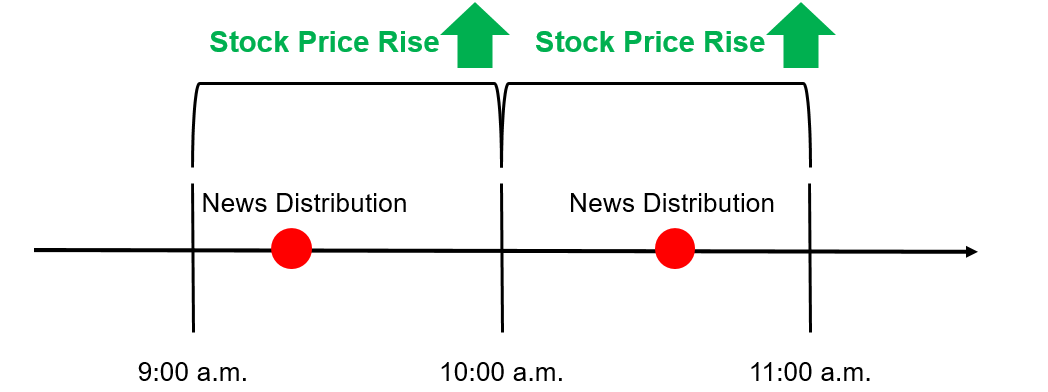
[Supplement to Rule 3]
If a buy signal were to occur during the 9 a.m. period, the stock would be bought at the opening of the 10 a.m. period, and a long position would be taken. If a sell signal occurred during the 1 p.m. period, the stock would be sold short at the opening of the 2 p.m. period. In the event of multiple signals occurring during a given day, the following trading procedures would be used. If the same signal were to occur, the position would be maintained without buying additional shares.
Figure 2: When the Same Signal Occurs
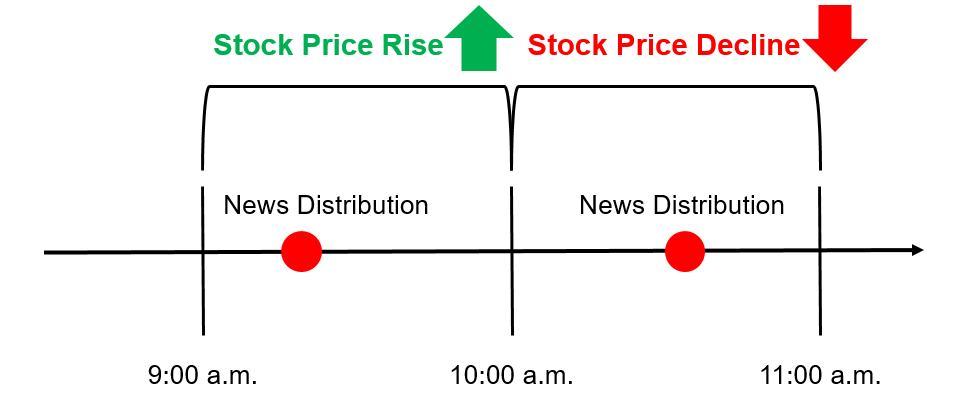
How should we respond when different signals occur? For example, if a buy signal were to occur during the 9 a.m. period and a long position was taken during the 10 a.m. period, and then a sell signal were to occur during the 10 a.m. period following the stock price declines in response to the news, the stock would be sold at the opening during the 11 a.m. period. In addition, the stock would be sold short to open a short position.
Figure 3: When Different Signals Occur
Practical Example of Stock Investment Strategy
Table 1 uses SoftBank Group (SoftBank G, 9984) as an example and summarizes the number of news items released during the trading session, the stock price, and the occurrence of buy/sell signals on December 8, 2022.
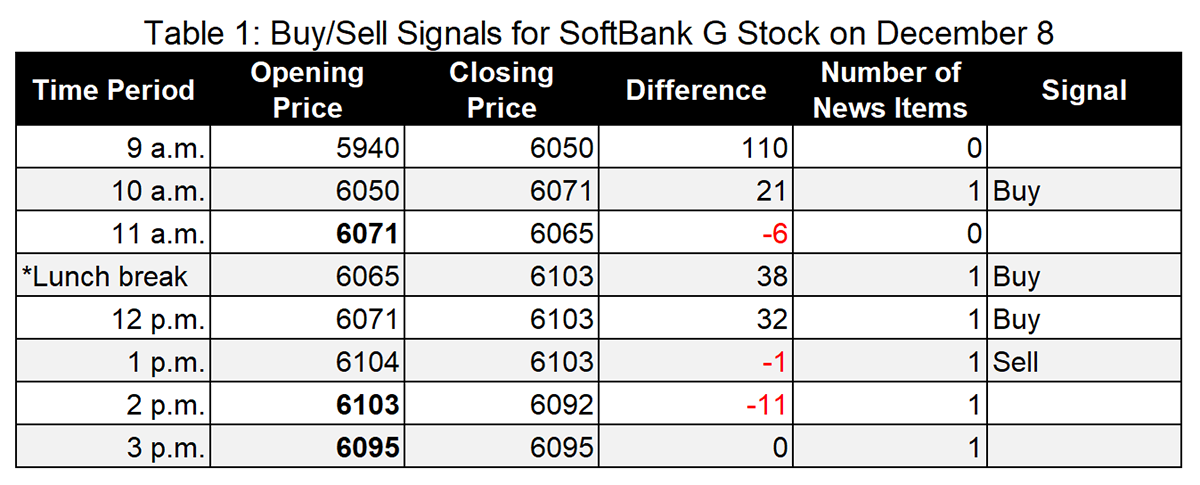
Note: Bolded values are prices to buy or sell based on the signal.
Table 2 summarizes the investment performance following the buy/sell signals in Table 1.
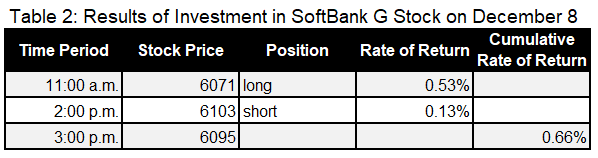
On December 8, a long position was taken at 11:00 a.m. based on a buy signal generated during the 10 a.m. period. The position was eliminated at 2:00 p.m. based on a sell signal generated during the 1 p.m. period, followed by a short position, which was then eliminated and liquidated at the 3:00 p.m. market closing. The long position produced a return of 0.53%, and the short position yielded 0.13%, resulting in a one-day cumulative return of 0.66% on December 8.
Table 3 summarizes the history and performance of investment in SoftBank G stock when such an investment strategy was followed for the month of December 2022. For a total of 14 business days, the cumulative rate of return was a positive 2.55%.
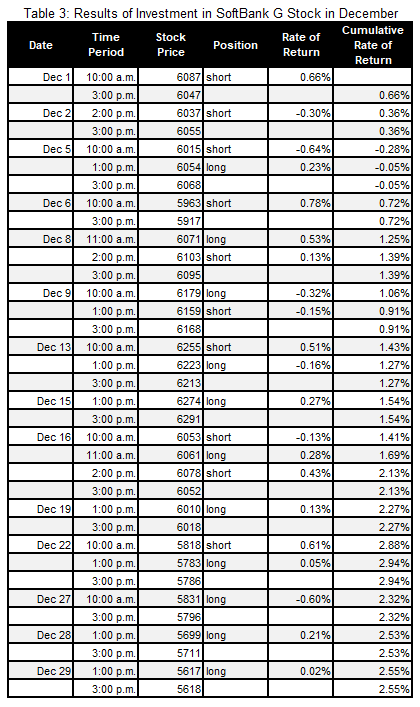
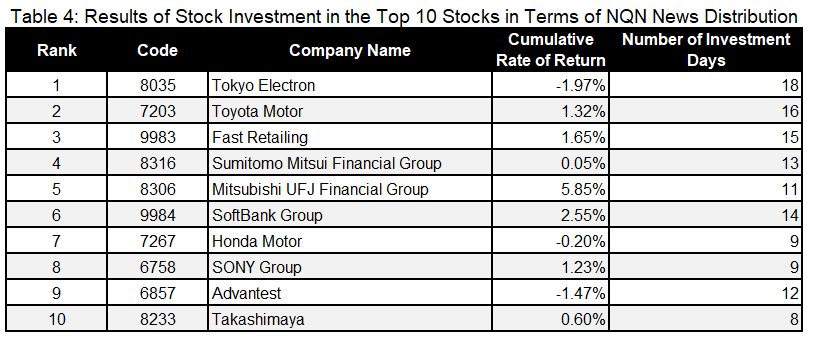
Table 4 summarizes the results from stock investment following the aforementioned rules for the 10 stocks with the largest number of corporate news items released by NQN News in December 2022. Note that the Bank of Japan, which had the largest number of news items released, is excluded here. The three stocks with negative returns were Tokyo Electron (8035), Honda Motor (7267), and Advantest (6857). The remaining seven stocks ended with positive rates of return. The average cumulative rate of return for the 10 stocks was 0.96%, and the average number of days invested was 12.5.
Return on Investment from Using NQN News
In this case study, we constructed an investment method that followed stock price trends before and after related news distribution, based on the assumption that stock prices fluctuate in response to NQN news. Then, we evaluated the investment performance. As a result, it was found that all of the 10 stocks selected for investment outperformed the TOPIX return of -5.26% during the one-month investment period in December 2022. This suggests that high performance can be obtained even during sluggish stock market periods by taking into account the timing of NQN news distribution and stock price trends.
Here, we adopted a simple strategy in which investment decisions were made on an hourly basis, and stocks were traded one unit at a time. Further improvement of performance can be expected by making some adjustments. Possible adjustments may include shortening the investment decision period to once every 30 minutes to increase investment opportunities; and not generating signals when an abnormal surge or plunge in stock prices is observed followed by a swing back with the fluctuation range exceeding a threshold.
NQN News on QUICK Data Factory
https://corporate.quick.co.jp/data-factory/en/product/data017/
Follow us on LinkedIn to stay updated with Japan Markets.