Japan Markets ViewReading Future Financial Results for Food Service Industry Using Monthly Sales & Business Activity Data
Aug 16, 2023
Summary
- Monthly Sales & Business Activity Data Provided by QUICK
QUICK collects, compiles, and provides data on monthly sales, number of stores, number of customers, etc. that companies publish on their corporate websites. - Reading Future Corporate Financial Results Using a Mathematical Model
We evaluated the predictability of sales of the restaurant chain companies using a mathematical model. - Reading Ahead of Current Year’s Sales Using a Modified Model
We predicted sales with greater accuracy using a model focused on predicting actual sales at the end of the current fiscal year.
Introduction
F-index, a data analysis consulting service provider in Japan, examined the effectiveness of the Monthly Sales & Business Activity Data provided by QUICK in anticipating sales published in financial statements (e.g., financial summaries, quarterly reports, and annual securities reports). The Monthly Sales & Business Activity Data is compiled by QUICK to provide business or management information, which is not available in earnings statements, based on the information disclosed by companies on their websites.
Items Comprising the Monthly Sales & Business Activity Data Disclosed by Companies
The Monthly Sales & Business Activity Data comprises various published indicators in addition to sales. They include real numbers, such as sales, number of stores, number of customers, etc., and relative values. When relative values, such as year-on-year values, are used instead of actual values, it is necessary to handle them appropriately, such as by using the cumulative rate of change for the published values.
Reading Future Corporate Financial Results Using a Mathematical Model
For this article, we constructed a mathematical model to estimate sales by combining the indicators published as the Monthly Sales & Business Activity Data with the financial results information of each company.
Using the mathematical model, we calculated the Last Twelve Months (LTM) predictive values based on the estimated sales for each month.
Here, we compare the LTM predictive values with the following three indicators:
(1) LTM actuals calculated based on quarterly actual sales obtained from financial statements
(2) Actual sales for the full-year financial results
(3) Company’s sales forecasts.
Figure 1 plots the four indicators for FLYING GARDEN (3317), a suburban restaurant chain operator.
Figure 1: LTM Predictive Values for Flying Garden (with Fiscal Year-End in March) and Three Indicators of Financial Results Information
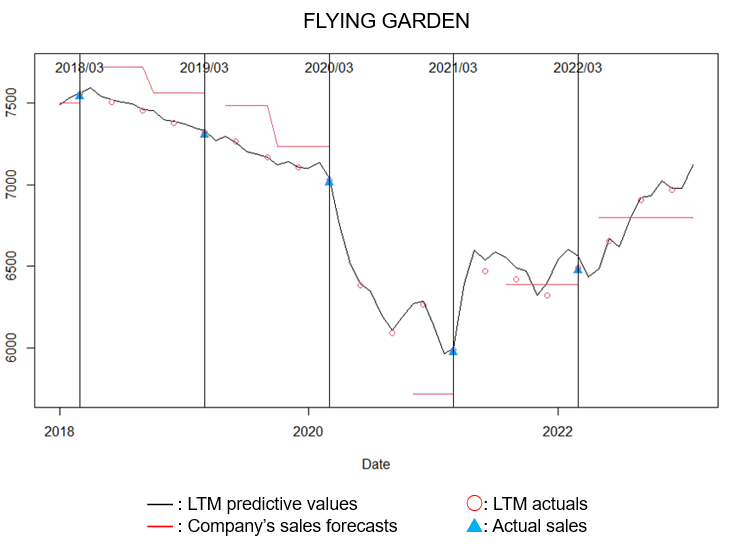
In FY2021, the company’s sales forecast remained undisclosed for some time due to the significant impact of COVID-19. In addition, quarterly reports and full-year results are released within 30 days of the end of the quarter and 45 days of the end of the fiscal year, respectively. This means that the Monthly Sales & Business Activity Data, which is released from the end of each month to the beginning of the following month, become available earlier. Therefore, the LTM predictive values can be used as a leading indicator for the LTM actuals and actual sales.
Figure 1 shows that in FY2019 and FY2020, when there was no impact from COVID-19, the LTM predictive values forecast the LTM actuals and actual sales very precisely. It also shows that the forecast has been revised downward from the bullish initial forecast. Since FY2021, when the impact of COVID-19 became significant, the company’s sales forecast has continued to deviate significantly from actual sales. On the other hand, LTM predictive values are still able to forecast LTM actuals and actual sales.
Next, we used the same indicators to examine the predictability of financial results information for the following restaurant chain companies:
– Ootoya Holdings (2705, Ootoya), a set meal restaurant chain; and
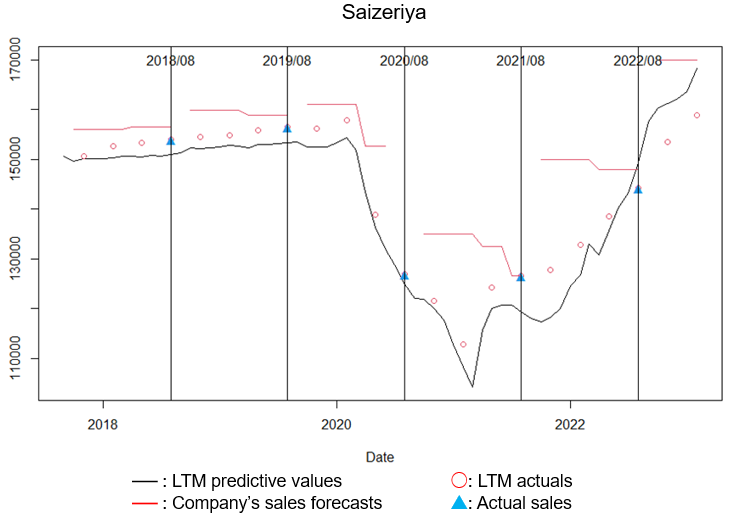
– Saizeriya (7581), an Italian restaurant chain.
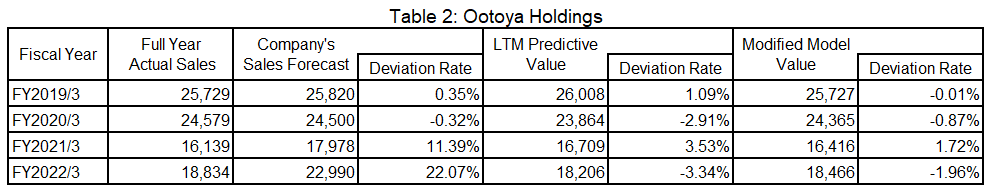
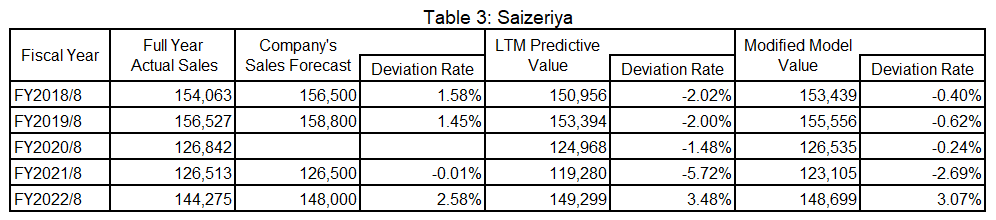
For these companies, as Figures 2 and 3 show, the LTM predictive values are effective in forecasting the LTM actuals and actual sales. However, in FY2021 (FY ending March 2021 for Ootoya and FY ending August 2021 for Saizeriya), when the impact of COVID-19 was significant, the LTM predictive values deviate significantly from the actuals. This suggests that a sales structure different from that of the normal period emerged during this period. For the period in the wake of COVID-19, the LTM predictive values capture the recovery in sales and predict precisely, with smaller deviations from the LTM actuals and actual sales.
Figure 2: LTM Predictive Values for Ootoya (with Fiscal Year-End in March) and Three Indicators of Financial Results Information
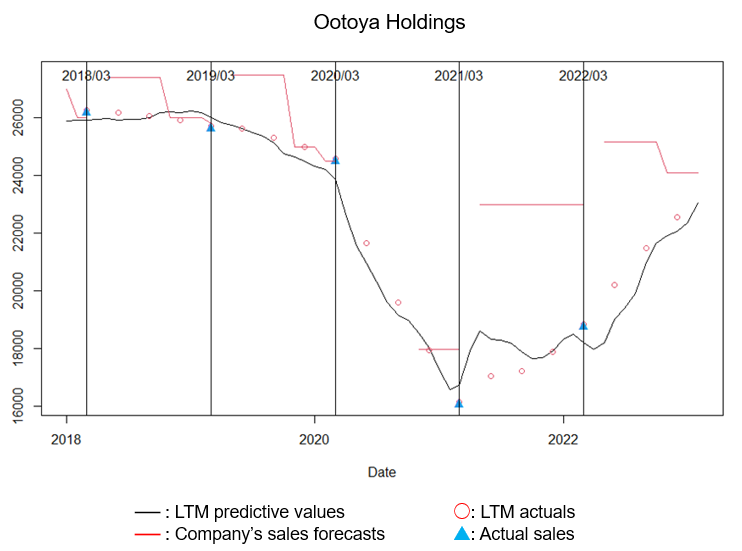
Figure 3: LTM Predictive Values for Saizeriya (with Fiscal Year-End in August) and Three Indicators of Financial Results Information
Reading Ahead of Current Year’s Sales Using a Modified Model
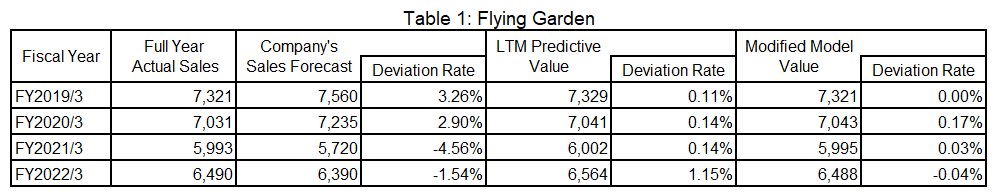
Next, we examined the possibility of modifying the model to more precisely forecast full year actual sales. Specifically, we calculated the LTM predictive values at the end of the fiscal year (modified model values) by combining the predicted monthly sales calculated using the model with the actual quarterly sales already announced during the current fiscal year. Then we compared the modified model values with the company’s sales forecasts and LTM predictive values.
Each value is summarized for Flying Garden in Table 1, Ootoya Holdings in Table 2, and Saizeriya in Table 3. For all fiscal years, the forecast accuracy of the modified model values is higher than that of the LTM predictive values. In addition, the forecast accuracy of modified model values is higher than that of the revised company’s sales forecasts for all fiscal years except Saizeriya’s fiscal year ending August 2022.
Conclusion
In this article, we examined the predictability of actual sales, which becomes available as financial results, using the Monthly Sales & Business Activity Data, which is based on the information released by companies. Due to the earlier timing of the announcement than that of financial results, the Monthly Sales & Business Activity Data is effective as a forecasting indicator because of its preliminary nature. The results also show that the LTM predictive values have very high forecasting accuracy, except for the period when the impact of COVID-19 was significant. During the pandemic-hit period, the sales structure was considered to be different from that of normal periods, and the company’s sales forecasts also deviated from actual sales. Furthermore, the predicted sales calculated using the modified model focused on predicting actual sales at the end of the fiscal year show a very high forecasting accuracy.
Monthly Sales & Business Activity Data on QUICK Data Factory
https://corporate.quick.co.jp/data-factory/en/product/data010/
Murata’s (6981) Financial Results Briefing Reveals “End of Smartphone and PC Inventory Adjustments”
Listing Approval for Actively Managed ETFs – Emergence of Japanese Version of ARKK?
Follow us on LinkedIn to stay updated with Japan Markets.