Japan Markets ViewIndustrial Production Index Forecasted with KDDI’s Human Flow Data (2)
Jul 18, 2022

In the previous article, we demonstrated the potential of multiple regression analysis of human flow data and the Industrial Production Index to produce forecasts that are more accurate than the METI’s preliminary values for certain industries. Forecasts utilizing human flow data allow for a quicker and more accurate picture of economic trends in each industry.
“KDDI Location Data”, which is KDDI’s service for providing human flow statistics data, (hereafter referred to as “human flow data”), serves as a major factor in estimating a company’s labor input. In this article, we forecast the Industrial Production Indices by industry, which are published monthly by METI, using human flow data.
Using the same data set as in the previous article, we analyze and forecast Industrial Production Indices by industry for four industries: Transport Equipment, Production Machinery, Chemicals (excl. Medicine), and Fabricated Metals. Multiple regression analysis is performed for forecasting, and RMSE (Root Mean Squared Error) is used for error evaluation.
1. Assumption
The timing of the Industrial Production Index publication, which is important in discussing the immediacy of the index, is as follows.
(e.g.) Data published in February 2022
Publication date: February 15
Revised value: December 2021
Preliminary value: January and February 2022
Revised values are released with a two-month delay, and preliminary values are presented for the two months through the current month. We calculate the RMSEs of published preliminary values and the forecasts using human flow data, then compare and evaluate them.
2. Analysis (Multiple Regression Analysis)
We create two types of models: a two-week model and a month-end model, and each model is defined as follows.
Two-week Model
Upon publication of the Industrial Production Index, we use the average of the human flow data for the first two weeks (1st-14th) of the month as the explanatory variable to create this model.
< Objective Variable >
Industrial Production Index: Revised value for the relevant month
< Explanatory Variable >
Industrial Production Index: Preliminary values for the relevant month and the previous month
Human flow data: Average of human flow data on the 14th of each month
< Period >
From February 2017 to March 2021
For instance, regarding the Industrial Production Index for February, only the preliminary values are released in February, and the revised values are unveiled in April. Upon publication of the preliminary values in February, we forecast the revised values of the index using the human flow data for the first two weeks of February in addition to the published preliminary value as explanatory variables.
Month-end Model
Forecasts are made using one-month human flow data as of the end of the month in which the Industrial Production Index is published.
< Objective Variable >
Industrial Production Index: Revised value for the relevant month
< Explanatory Variable >
Industrial Production Index: Preliminary values for the relevant month and the previous month
Human flow data: Average of human flow data at the end of each month
< Period >
From January 2017 to March 2021
As with the two-week model, we use the published preliminary values and the one-month average human flow data to forecast the revised value to be published two months later.
3. Results
Multiple regression analysis was performed for each industry using the data for the target period, with 70% as learning data and 30% as test data. The results of the RMSE calculation are shown below.
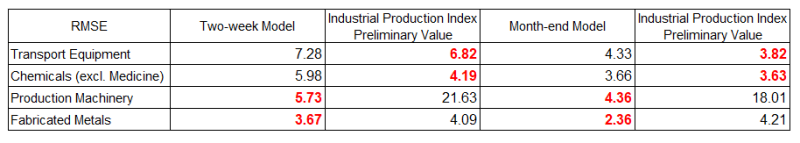
For the Transport Equipment and Chemicals (excl. Medicine), the RMSEs for Industrial Production Index preliminary value are smaller, but for the Production Machinery and Fabricated Metals industries, the forecast becomes more accurate when the human flow data are used.
Our Forecasts/ METI’s Preliminary Values and Revised Values
Two-week Model
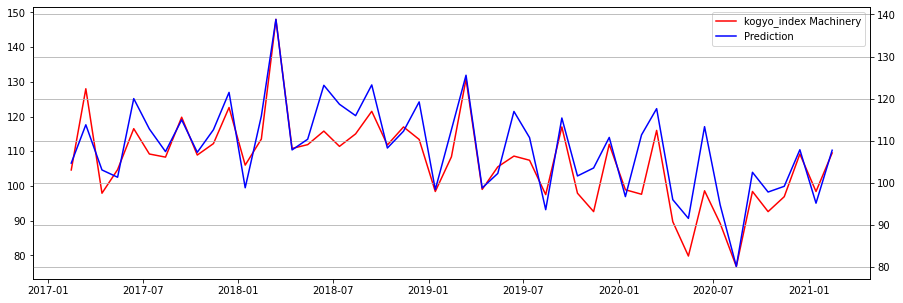
Preliminary Values of Industrial Production Index
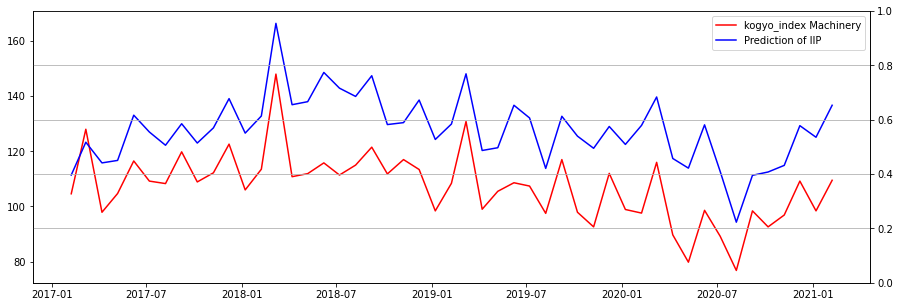
While there is a wide margin between the preliminary values (the blue line) and the revised values (the red line) of the Industrial Production Index, the two-week model produces forecasts closer to the revised values.
Absolute Errors between Our Forecasts/ METI’s Preliminary Values and Revised Values
Two-week Model
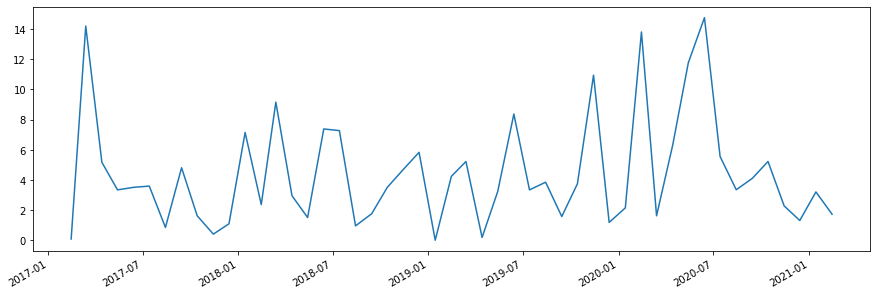
Preliminary Values of Industrial Production Index
The absolute errors also indicate that the model using human flow data has a smaller error than the published preliminary value of the Industrial Production Index, demonstrating that the model can make more accurate forecasts.
Human flow Data Improves Accuracy and Immediacy
Multiple regression analysis using human flow data was performed to forecast Industrial Production Indices by industry, providing forecasts that are more accurate than published preliminary values for certain industries.
KDDI Location Data allows for acquiring accurate location information with fine mesh granularity and receiving data for the previous two days on a daily basis. By using human flow data, which is highly accurate and immediate, the Industrial Production Index, which is released two months later, can be forecasted more quickly and accurately. Daily changes in labor input can be very valuable information in capturing economic trends in each industry.
KDDI Location Data on QUICK Data Factory
https://corporate.quick.co.jp/data-factory/en/product/data038/
QUICK Holds ESG Seminar to Discuss Information Disclosure
Japanese Stocks Rely on a Weak Yen; Which Stocks Are More Resilient to Market Volatility?
Follow us on LinkedIn to stay updated with Japan Markets.