Japan Markets ViewEquity Investment in Companies Implementing Share Buybacks
Feb 14, 2023

Introduction
QUICK collects historical data on share buybacks from the information disclosed by Japanese listed companies. The data includes information such as board resolution dates, announcement/commencement dates, numbers of shares purchased, total amounts purchased, and purchase methods. Using these data, F-index, a data analysis consulting service provider in Japan, conducted a verification study. This article discusses the impact of companies’ share buyback information on equity investment.
Companies Announcing Share Buybacks
This study covered 15,577 share buybacks announced by companies from February 21, 2002 to August 30, 2022. The number of companies subject to the verification was 2,997. The breakdown of the number of companies announced by year is shown in the table and figure below.
Table 1: Number of Companies that Disclosed Share Buyback Information
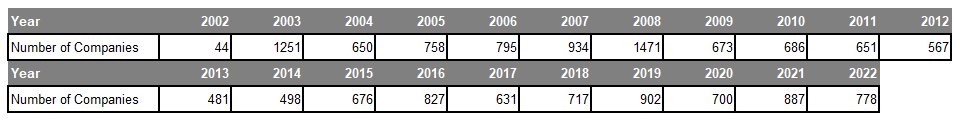
Figure 1: Trends in the Number of Companies that Disclosed Share Buyback Information
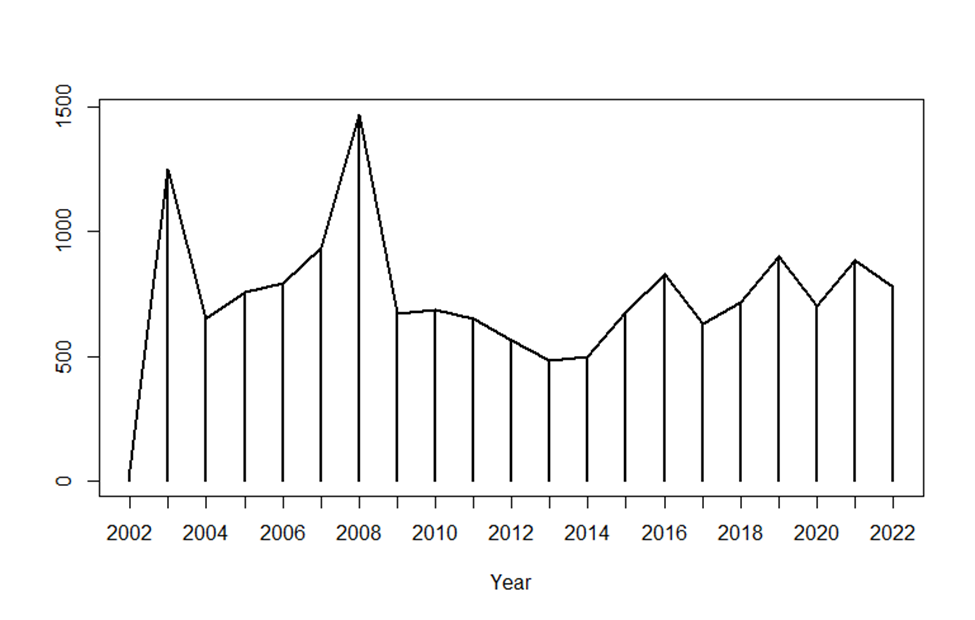
The number of companies announcing share buybacks increased sharply around the time the new Companies Act came into effect in May 2006, which relaxed procedures for share buybacks. The number declined after the financial crisis in 2008, but has been on a moderate uptrend in recent years. Note that the figures for 2022 are for the period through the end of August. Table 2 shows the cumulative number of companies that announced share buybacks in each of the last three years.
Table 2: Cumulative Number of Companies that Announced Share Buybacks for Each Year in the Last Three Years (Top Row: Cumulative Number of Companies Announcing Buybacks; Bottom Row: Progress Rate by Year)
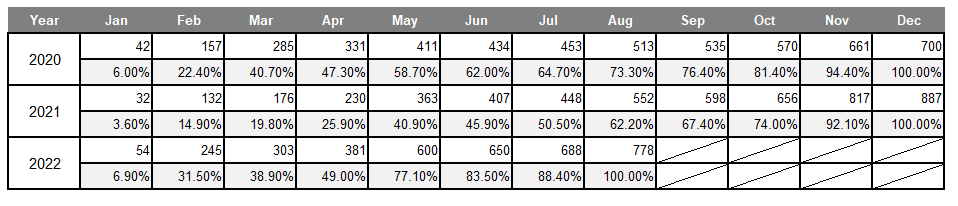
Although the statistics for 2022 are only through the end of August, the total number of companies that announced share buybacks reached 778. The cumulative number increased sharply by 226 from 552 in the same month of the previous year. In 2020, more than 60% of companies announced share buybacks in the first half of the year through June, and fewer companies in the second half. In 2021, on the other hand, only 45.9% of the total number of announcements were made in the first half of the year. More than half of the companies announced in the second half of the year, especially in November. In the first half of 2022, the peak was in May, as in the previous year. If the same trend continues in the second half of the year, the number of announcements is expected to exceed that of the previous year.
An increasing number of companies have recently announced share buybacks. The following section discusses the possibility of using share buyback information for equity investment.
Equity Investment based on Share Buyback Information
Let’s take a look at whether information about implementing share buybacks affects the performance of equity investment in the companies.
First, we assume that information was available to investors on the day the share buyback was announced (“announcement date”). In other words, we assume that no insider information or other information was available. Most buybacks are announced at JST 3:00 p.m. , when the market closes. Therefore, we assume that the stocks were purchased at the beginning of trading on the business day following the announcement date (the market open of the following day). Following two types of stock holding periods are considered: “One day (buying the shares at the market open and selling then at the market close on the next business day)” and “One week (buying the shares at the market open on the next business day and selling at the market close one week later)”. The following investment performance indicators are calculated: (1) Expected return (average of returns), (2) Risk (standard deviation of returns), and (3) Expected return per unit of risk ((1) divided by (2)).
The following table shows performance indicators for equity investment based on information on share buybacks for the three years 2020, 2021, and 2022. The numbers of stocks invested in are 682, 865, and 763, respectively. Note that for 2022, only information announced by the end of August is used.
Table 3: Investment Performance for Each Year
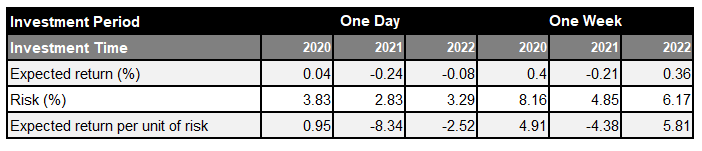
Favorable investment performances are not obtained for most of the investment periods and years covered. When the investment period is set to one week, positive expected returns of 0.40% and 0.36% are obtained in 2020 and 2022, respectively. The expected returns shown here are calculated based on the absolute return of each company. In other words, effects of the stock market environment at that point in time are not excluded. It is hard to tell whether positive returns are brought about simply because of booming stock market conditions, rather than by the impact of stock selection based on information about stock buybacks. Then, the active returns are calculated using TOPIX as the benchmark to indicate the market conditions at that time. As in the case of equity investment, for one-day investment, the benchmark return is calculated from the opening price on the business day following the announcement date and the closing price on the same date; and for one-week investment, it is calculated from the opening price on the business day following the announcement date and the closing price one week later. The difference between the benchmark return and the absolute return is used as the active return. Table 4 summarizes the investment performances based on the active returns.
Table 4: Investment Performances Based on Active Returns
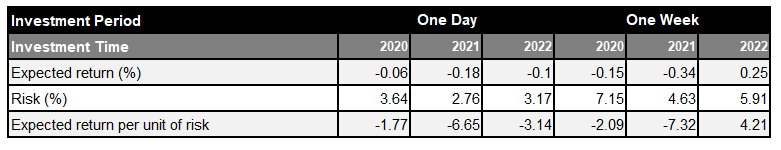
The positive expected return based on the absolute return yielded from one-week investment in 2020 turns into negative when calculated with the active return. It is likely that the stock market was booming during the investment period and that better returns could have been obtained by investing in stocks regardless of the share buyback information. On the other hand, the one-week investment in 2022 yields a positive performance even considering the stock market movements.
Conclusion
This article examined the performances of equity investment using share buyback information. While favorable performance could be achieved in certain time periods, it was generally confirmed that equity investment strategies that simply use share buyback information do not produce favorable performance.
Then, is it impossible to use share buyback information for equity investment strategies? When a company conducts a share buyback, various conditions are set. This means that information on a company’s share buyback should not be simply used for equity investment strategies, but should be used taking the conditions set for each buyback into consideration. Table 5 provides the investment performances when the investment strategies were formulated taking into account the set conditions for share buybacks and using the same investment policy as before. To exclude the influence of the stock market environment, all calculations are based on active returns.
Table 5: Investment Performances with Equity Investment Strategies Considering the Set Conditions for Share Buybacks (Calculated Using Active Returns)
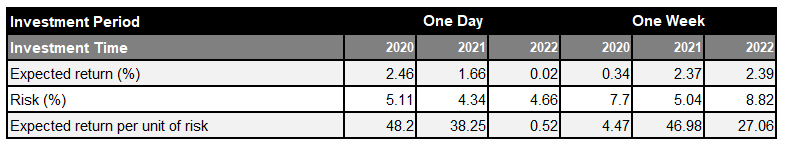
Performance improvements can be observed for all investment periods and times. The next article details how we handled the share buyback information and developed the equity investment strategies.
QUICK provides the share buybacks data introduced in this article via API.
Share Buybacks Data on QUICK Data Factory
https://corporate.quick.co.jp/data-factory/en/product/data029/
Follow us on LinkedIn to stay updated with Japan Markets.