Japan Markets ViewVerification of usefulness of Honda Probe Data
Jul 06, 2022

What’s “Honda Probe Data”?
Honda Probe Data is geolocation data based on driving data of approximately 3.7 million vehicles.
This data shows how many customers visit the specific area and how long they stay there.
POC
To discover new usage of the big transportation data, Honda Motor and QUICK conducted POC. From several choices of POC ideas, we selected and examined the relationship between the actual number of customers visiting retail stores and the number of customers estimated from Probe Data. Among the 350+ listed tickers in retail sector, FOOD & LIFE COMPANIES Ltd. (3563, F&LC), which operates the sushi restaurant chain “Sushiro,” is used in this POC.
The big reason we did not select home electronics retailer or such but selected restaurant chain is because visiting the store is equal to eating out, it is considered that they are always consuming.
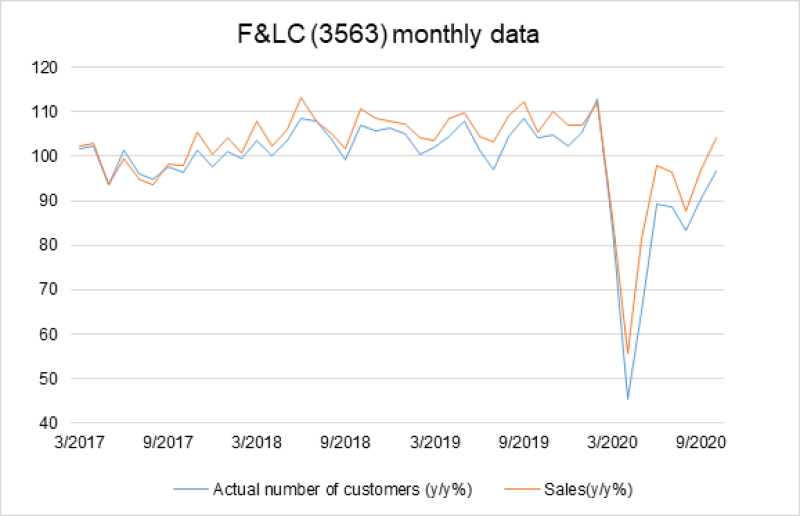
Figure1 is monthly data disclosed in F&LC’s IR website. As expected the number of customers (y/y%) and revenue(y/y%) are highly correlated.
There are many type of alternative data which estimate the number of customers coming into the store, for example satellite, mobile GPS, and apps ping credit card etc. The point of this POC is to see if the Probe Data accurately reflects the actual number of customers. Moreover Probe Data can be the one for estimating revenue of listed tickers.
Analysis Method and Data Set Sample
Simple linear regression analysis is used under the condition that actual number of customers as dependent variable(y) and the estimated number of customers from Probe Data as an independent variable(x).
There are 547 Sushiro shops in Japan as of 12/11/2020. We picked up 4 shops from Tokyo region.
Raw Data (Probe Data) Processing
– Historical period is from 1/2017 to 9/2020 daily base
– Daily customer number is estimated in each store and aggregated
– Aggregated to monthly number
– Monthly data is transformed to y/y% as dependent variable is disclosed as y/y%
Result
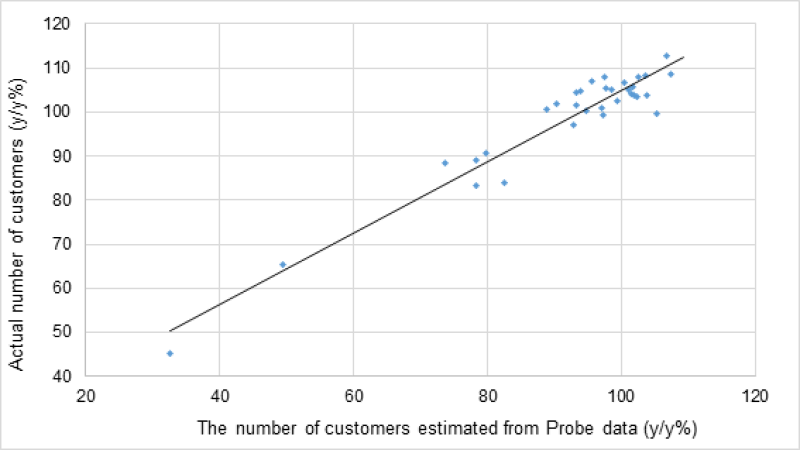
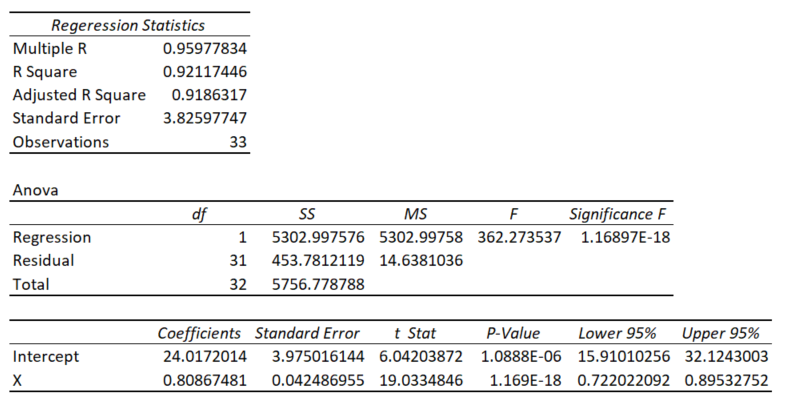
Figure2 shows highly correlated linear relationship and ANOVA table shows high R Square. And from P-Value of coefficients, we could reject H0=b0=b1=0
Honda Drive Data Service on QUICK Data Factory
https://corporate.quick.co.jp/data-factory/en/product/data040/
Nippon Gas Selected as a “DX Grand Prix 2022”; What was Evaluated?
High-margin Stocks Expected to Tolerate Higher Commodity Prices and Wages
Follow us on LinkedIn to stay updated with Japan Markets.