Japan Markets ViewReading Ahead Retail Performance Using Vehicle Driving Data (1)
Apr 25, 2023
The vehicle driving data provided by Honda Motor Co., Ltd. (7267) could be used to predict the performance of retail companies, etc. The number of cars visiting stores would be a useful information especially for short-term investments.
An analysis was conducted using the “Honda Drive Data Service (Customer Index)” (hereafter, “Customer Index”) provided by QUICK. This index calculates data on visits to retail stores and factories by obtaining vehicle driving data with the consent of users. For this analysis, data compiled on a monthly basis was used.
Linkage between Number of Store Visitors and Sales
QUICK provides the “Monthly Sales & Business Activity Data” by collecting monthly sales figures published by companies on their websites. For Olympic Group (8289), which operates discount stores and other businesses, a comparison was made between the YoY percentage changes in same-store sales and same-store customer counts. Note that both sales and customer counts are published monthly and based on the combined totals for the food and non-food segments. The following chart shows the results from September 2017 through October 2021.
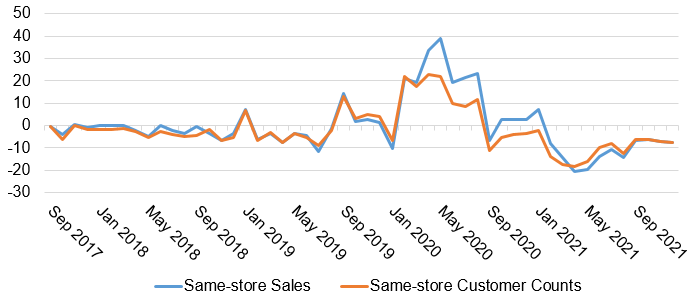
The number of store visitors and sales are linked fairly strongly. This suggests that sales could be predicted in advance by using the Customer Index as an alternative data source for the number of visitors.
Forecasting Changes in Sales at the End of the Month
Monthly sales figures for Olympic Group are published at the middle of the following month (the 15th of the month) or later. In other words, there is a time lag of more than two weeks between the end of the month and the announcement of sales. Therefore, the Customer Index was compiled at the end of the month to predict the same-store sales.
Based on same-store sales up to the previous month, estimates were calculated using the current month’s Customer Index. Specifically, sales were estimated by determining how far the Customer Index deviated from the historical average and assuming that same-store sales also deviated by the same degree.
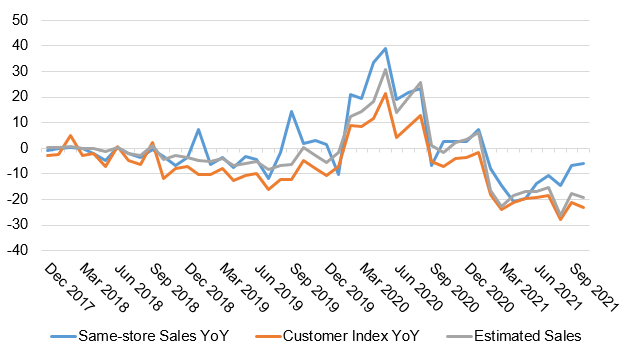
The above chart indicates the results. Estimated sales show almost the same trend as actual sales. The correlation coefficient between them is as high as 0.85. As a result, it was found that the change in sales can be predicted by using the Customer Index.
Financial markets factor company performance into stock prices based on quarterly earnings announcements. If a company discloses sales and orders on a monthly basis, the stock price moves according to the monthly disclosure prior to the quarterly earnings announcement. For short-term investments, the Customer Index could be used to obtain useful trading information in advance of the monthly announcement.
The Customer Index is suitable for real-time monitoring of changes in business performance because results are available on a daily basis. Corporate performance could be forecasted even earlier by using a forecasting model that accumulates daily data without waiting until the end of the month.
Continue to Reading Ahead Retail Performance Using Vehicle Driving Data (2)
Honda Drive Data Service (Customer Index) on QUICK Data Factory
https://corporate.quick.co.jp/data-factory/en/product/data040/
Monthly Sales & Business Activity Data on QUICK Data Factory
https://corporate.quick.co.jp/data-factory/en/product/data010/
Follow us on LinkedIn to stay updated with Japan Markets.