Japan Markets ViewReading Ahead Retail Performance Using Vehicle Driving Data (2)
May 11, 2023
The previous article demonstrated the potential of using vehicle driving data provided by Honda Motor Co., Ltd. (7267) to forecast business performance of retail companies. Daily data on the number of cars visiting stores can be used to predict sales without waiting for companies to make public announcements.
QUICK provides the “Honda Drive Data Service (Customer Index)” (hereafter, “Customer Index”) and the “Monthly Sales & Business Activity Data,” which collects monthly sales figures published by companies on their websites. In this article, an analysis is performed of monthly same-store sales of Shimamura (8227), a specialty apparel retailer, using the Customer Index.
Sales Linked to Number of Cars Visiting Stores
The chart below shows actual same-store sales and sales estimated using the Customer Index. The sales were estimated by determining how much the Customer Index deviates from the historical average and assuming that same-store sales also deviate by a similar degree.
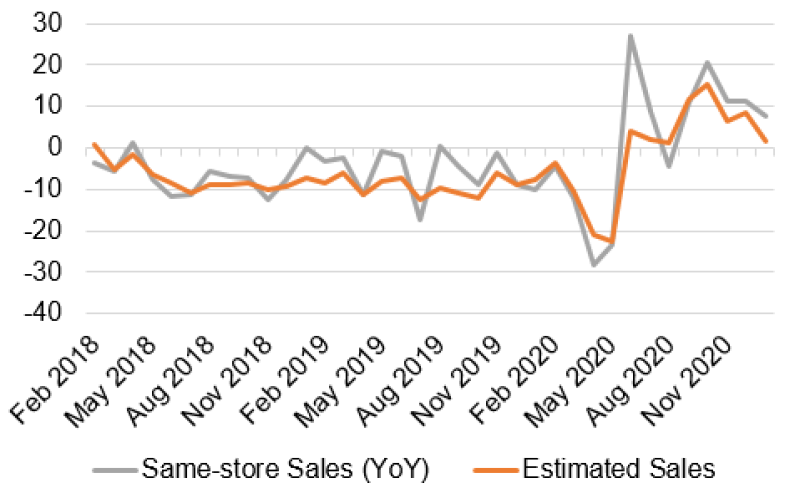
The chart shows that the estimated sales are almost in line with the actual sales. The correlation coefficient between the two was as high as 0.88. Forecasting business performance using the Customer Index at the end of the month, when all daily data becomes available, is also proved to be effective in Shimamura’s case.
However, Shimamura often announces its monthly performance (for the period from the 21st of the previous month to the 20th of the current month) around the 23rd of the same month as its monthly results. Compared to Olympic Group (8289) discussed in the previous article, there is less time lag until the announcement. This may make the use of the Customer Index less advantageous if the forecast is made at the end of the aggregation period.
Forecasting Sales before the End of the Month
Hence, leveraging the strength of the Customer Index being provided on a daily basis, we forecasted sales at a time before the end of the month (the end of the monthly sales aggregation period).
Here, Shimamura’s September 2020 results (from August 21 to September 20, 2020) are taken as an example. In this month, the company’s same-store sales turned positive YoY, and its stock price rose sharply after the results were disclosed on September 23. If the company’s sales increase had been known before that, useful stock purchase information would have been available prior to the performance announcement.
First, as of August 28, one week after the start of the period, the Customer Index for the week of August 21-27 was aggregated. An autoregressive model was used to predict and aggregate the number of cars to visit the stores for the remaining period from August 28 to September 20, and the Customer Index for the month of September was estimated. Based on this, monthly sales estimates were calculated.
The following chart indicates the results. In addition to actual sales, the chart shows the results of autoregressive forecasting based on past same-store sales without using the Customer Index in order to verify the model’s forecasting performance.
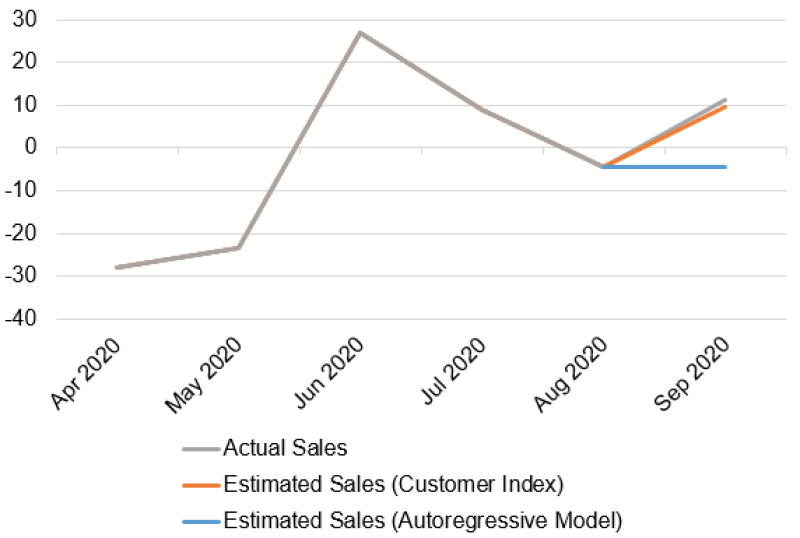
The chart demonstrates that the analysis using the one-week Customer Index has a higher accuracy in predicting the actual results than the figures derived using only historical sales figures.
Back to Reading Ahead Retail Performance Using Vehicle Driving Data (1)
Honda Drive Data Service (Customer Index) on QUICK Data Factory
https://corporate.quick.co.jp/data-factory/en/product/data040/
Monthly Sales & Business Activity Data on QUICK Data Factory
https://corporate.quick.co.jp/data-factory/en/product/data010/
Reading Ahead Retail Performance Using Vehicle Driving Data (1)
Top Scoring Stocks with Positive Earnings – Inbound, Steel, General Electric
Follow us on LinkedIn to stay updated with Japan Markets.