Japan Markets ViewReading Ahead Food Manufacturers’ Performance Based on Consumers’ Purchase Statistics Data
May 16, 2024
The consumers’ Purchase Statistics Data Provided by Toshiba Data Corporation (Toshiba Data) can potentially be used to quickly forecast the performance of companies manufacturing consumer goods such as food products.
Toshiba Data provides data from Toshiba Group’s digital receipt service after processing it in a way that purchasers and retailers cannot be identified. Linking a product to the stock code of the manufacturer facilitates analysis in association with the corporate information. This article uses this data to examine the linkage between product sales at retailers and the manufacturers’ quarterly sales.
Correlation between “Price PI Values” and Corporate Sales
To examine the correlation, we converted product purchase statistics data into the “Price Purchase Index (PI) values” and compared them with the total sales of the company that manufactured the product. The Price PI values represent the sales amount of a given product divided by the number of visitors to retail stores. For example, it shows the amount of sales of the product per 1,000 visitors. Using the Price PI values allows us to determine the “product support rates,” which are unaffected by changes in the number of visitors to stores.
1. Morinaga Milk Industry (2264)
We compiled the quarterly Price PI values for a product of Morinaga Milk Industry (Morinaga Milk), a major dairy company, and calculated the YoY values. The following chart shows those values together with the company’s quarterly sales YoY.
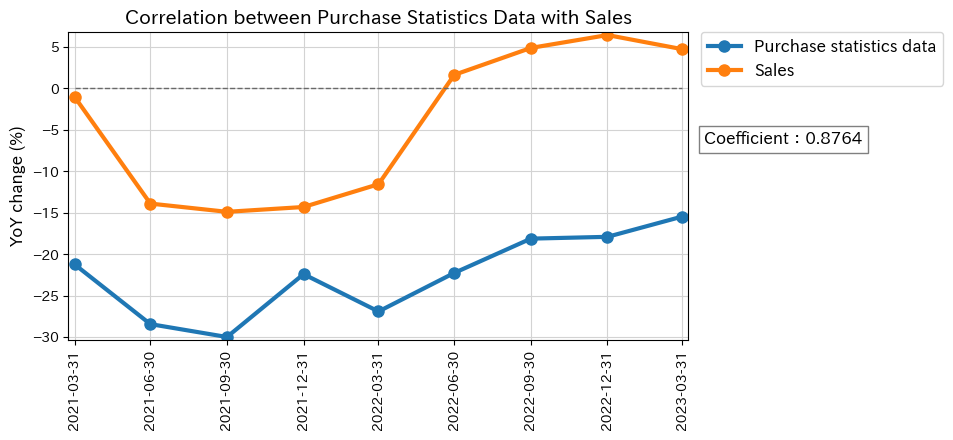
The chart indicates that the two sets of data are generally linked. The correlation coefficient is 0.87. The linkage is very strong, as plus one implies a perfect forward correlation.
2. Meiji Holdings (2269)
Using the same method as Morinaga Milk, we compared the Price PI values and quarterly sales of Meiji Holdings, a major dairy and confectionery company.
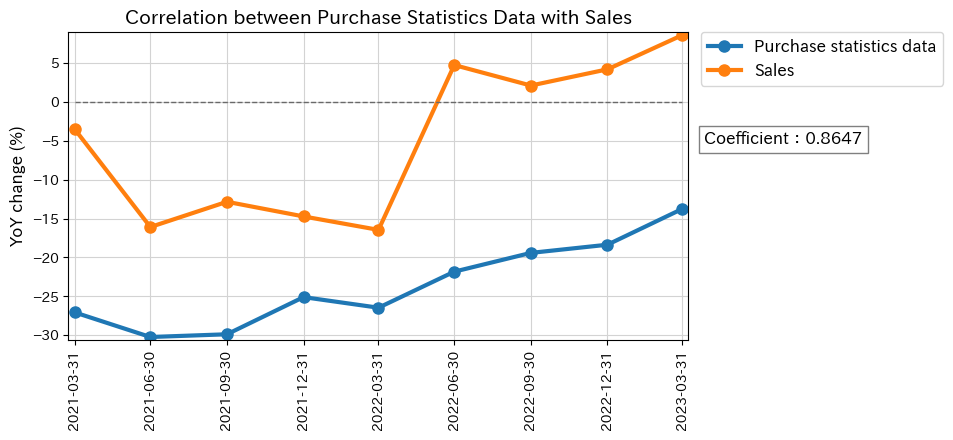
The chart also indicates that the two sets of data are generally linked. The correlation coefficient is as high as 0.86.
Purchase Statistics Data Is Updated Daily
Strong correlations were revealed as a result of comparing the purchase statistics data of the two companies’ products with their company-wide sales. While listed companies’ quarterly results are announced about a month after the end of the fiscal year, Toshiba Data’s information is provided on a daily basis. Obtaining Toshiba Data’s purchase statistics data in real time would allow us to predict company sales to some extent before the announcement of financial results.
Purchase Statistics Data Provided by Toshiba Data on QUICK Data Factory
https://corporate.quick.co.jp/data-factory/en/product/data047/
Follow us on LinkedIn to stay updated with Japan Markets.