Japan Markets ViewImpact of News on Stock Price Fluctuations and Evaluation of Investment Performance
Feb 14, 2023

QUICK distributes the data disclosed by Japanese listed companies on EDINET and TDnet as news, and also provides them as text data. Using these data, F-index, a data analysis consulting service provider in Japan, conducted a verification study.
Introduction
In order to predict with a high degree of certainty the impact of a news story on the price of the stock associated with that news after it has been distributed, it is necessary to make a comprehensive judgment through the following steps:
1. Read and understand the content of the news
2. Organize stock-specific background information
3. Confirm market conditions
It would be difficult even for an analyst well versed in the stock to immediately perform this series of steps.
In this report, we constructed a model of next-business-day stock price fluctuations for pharmaceutical sector stocks focusing on clinical trial success or failure news. After generalizing this set of predicting procedures, we used the statistical model to automatically identify news impact labelling. Then, we examined how well the news impact labeling results explain the subsequent stock price performance.
Scope of verification
The scope of this verification study is as follows:
Period: January 1, 2020 through August 31, 2022
Stocks: Pharmaceutical Sector
News content: Success or failure of clinical trials
For the explanatory variables of the statistical model, the most appropriate variables were selected from among the following group to model the magnitude of the stock price fluctuation on the next business day. For the news content, necessary information such as the phase of the clinical trial was extracted and used for prediction.
Stock-specific background information: market capitalization, listed section name, stock price (daily change rate, 5-day moving average divergence rate, 25-day moving average divergence rate), trading value (preceding day, 5-day moving average, 25-day moving average) , trading volume (preceding day, 5-day moving average, 25-day moving average), outstanding sales on margin (negotiable), outstanding sales on margin (standardized), outstanding purchases on margin (negotiable), outstanding purchases on margin (standardized)
Market information: Daily change rate, 5-day moving average divergence rate, and 25-day moving average divergence rate for each index
*Target indexes: NASDAQ, S&P500, TOPIX, TOPIX-17 Pharmaceutical, TSE Second Section Index, JASDAQ INDEX, TSE Mothers Index, TSE Prime Market Index, TSE Standard Market Index, TSE Growth Market Index
Impact of Clinical Trial Success News on Investment Performance
In order to ensure consistency in the evaluation conditions for the impact of news on stock prices, this verification covered news announced between the market close and the market open of the next business day. As a result, there were 28 news stories of successful clinical trials announced by companies in the pharmaceutical sector during the period covered by the validation. A simple statistical model was used to predict stock price fluctuations for the next business day, taking into account the number of news to be analyzed. The impact of each news story was labeled as “high impact” or “low impact” based on the predictions using this model.
Assuming that shares were purchased at the market open of the business day following the news distribution, investment performances were evaluated over two different investment periods (“One day (buying the shares at the market open and selling them at the market close on the next business day)” and “One week (buying the shares at the market open the next business day and selling at the market close one week later”). The following investment performance indicators were calculated: (1) Expected return (average of returns), (2) Risk (standard deviation of returns), and (3) Expected return per unit of risk ((1) divided by (2)). Then, the active returns were calculated using TOPIX as the benchmark in the same way.
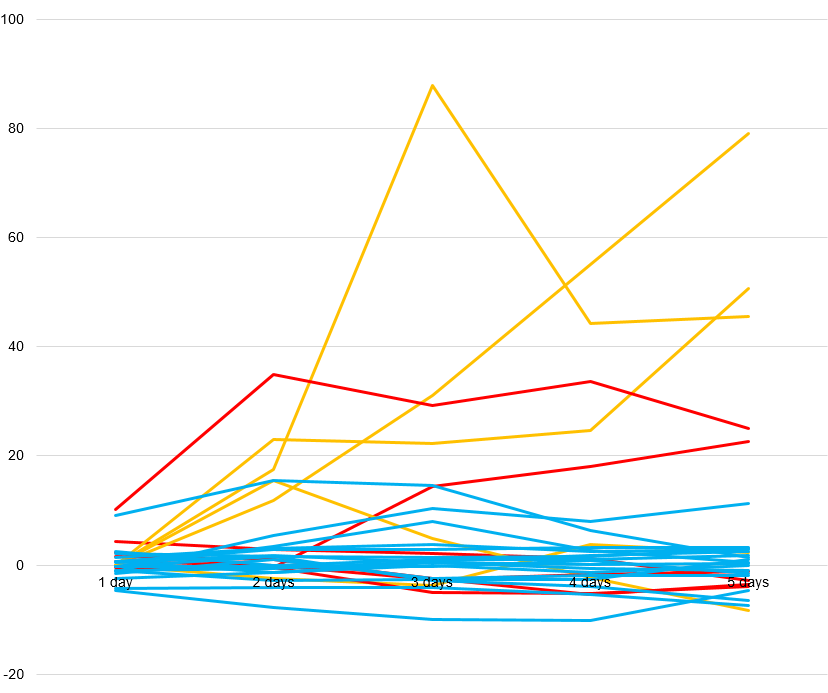
Based on the results of verification using the stock price volatility model, 11 news stories were labeled as high impact and 17 news stories were labeled as low impact. Table 1 summarizes the returns by investment period for each news impact labeling. In addition, Figure 1 illustrates the one-week return trends. In the event a stock hits limit-up on the following business day without being traded, it is likely that the stock will not be available for purchase on that day. For this reason, the performances were also summarized separately, excluding the news reporting the limit-up on the next business day.
Both in terms of normal and active returns, better investment performances were confirmed for stocks associated with news labeled as high impact compared to those with news labeled as low impact. Even when excluding news about the limit-up on the next business day, a return of about 6% could be expected for one-week periods.
Table 1: Investment Performance by Stock Price Fluctuation Impact Labeling for Clinical Trial Success News

Figure 1: Trends in Return by Stock Price Fluctuation Impact Labeling for Clinical Trial Success News

*High imact (red line) ,high impact (limit-up on the next business day, yellow line) and low impact (blue line)
Stock Price Fluctuation after the Distribution of Clinical Trial Failure News
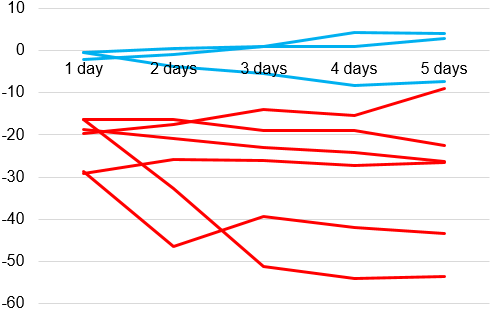
Similarly, we constructed a model of next-business-day stock fluctuations focusing on the news reporting clinical trial failures, Based on the results of prediction using this model, 6 news stories were labeled as high impact and 3 news stories were labeled as low impact. For the news of clinical trial failures, the results of the labeling were evaluated not in terms of investment performance, but rather by visually checking the stock price change after the news was distributed. Figure 2 shows the trends in returns based on the closing prices on the news distribution date (or the previous business day if the news was distributed just before the market open) Prices of stocks tied to the news labeled as high impact fell more than 10% on the following business day, and continued to fall or remained mostly flat thereafter. This suggests that it would be better to hold off buying the stocks associated with this news labelled as high impact for at least a week. On the other hand, stocks associated with the news labelled as low impact did not show much fluctuation in stock prices.
Figure 2: Trends in Share Prices after Distribution of Clinical Trial Failure News by Stock Price Fluctuation Impact Labeling

*High imact (red line) and low impact (blue line)
Conclusion
This report modeled the stock price fluctuation on the following business day, taking into account the news content as well as stock-specific background information and market conditions. Based on the results of this modeling, news stories were labeled, and it was confirmed that good performance can be achieved by following an investment strategy in accordance with the results of this labeling for news stories about successful clinical trials. Regarding the news of the failed clinical trial, the stock price fell by more than 10% on the next business day, and has continued to fall or remained almost flat since then. It was confirmed that it would be better to hold off buying such stocks for a while, rather than to consider these stock price declines as an opportunity for bargain buying.
In general, it takes a lot of effort just to read the news. However, without a comprehensive judgment that takes into account stock-specific background information and market conditions, it is difficult to accurately predict stock price fluctuations on the next business day. In this verification study, we tested the automation of this series of prediction procedures for clinical trial success/failure news, whose contents are relatively easy to understand. As a result, we obtained relatively good outcomes. It should be interesting to expand the scope of this scheme and examine it in news with a different content.
QUICK’s Company Disclosure Materials service analyzes the contents disclosed on EDINET and TDnet and provides them via API as tag information such as stock code, company name, etc.
Company Disclosure Materials (TDnet/ EDINET) on QUICK Data Factory
https://corporate.quick.co.jp/data-factory/en/product/data011/


