Japan Markets ViewEvaluating Predictability of Share Buybacks
Nov 06, 2024
In general, share buybacks are expected to boost stock prices. Predicting the occurrence would greatly assist in investment decisions. Therefore, we evaluated whether we could predict corporate buyback announcements using the Share Buybacks Data provided by QUICK, a financial information provider in Japan.
Share Buybacks Boost Stock Prices
We examined stock price changes before and after share buybacks using data from all publicly traded companies that repurchased their own shares between 2012 and 2023. The chart below shows the average stock price change rates for each year of companies that conducted buybacks. It illustrates the stock price change rates over the three years before and after the year of their buybacks (T=0). The bold red line shows the average of such change rates before and after the buybacks.
For example, the “Share Buybacks in 2012” line in the chart shows the results of calculating the percentage change in the stock price of each company that announced a buyback in 2012 over the three years before and after the announcement, and averaging these results across the stocks covered by this study.
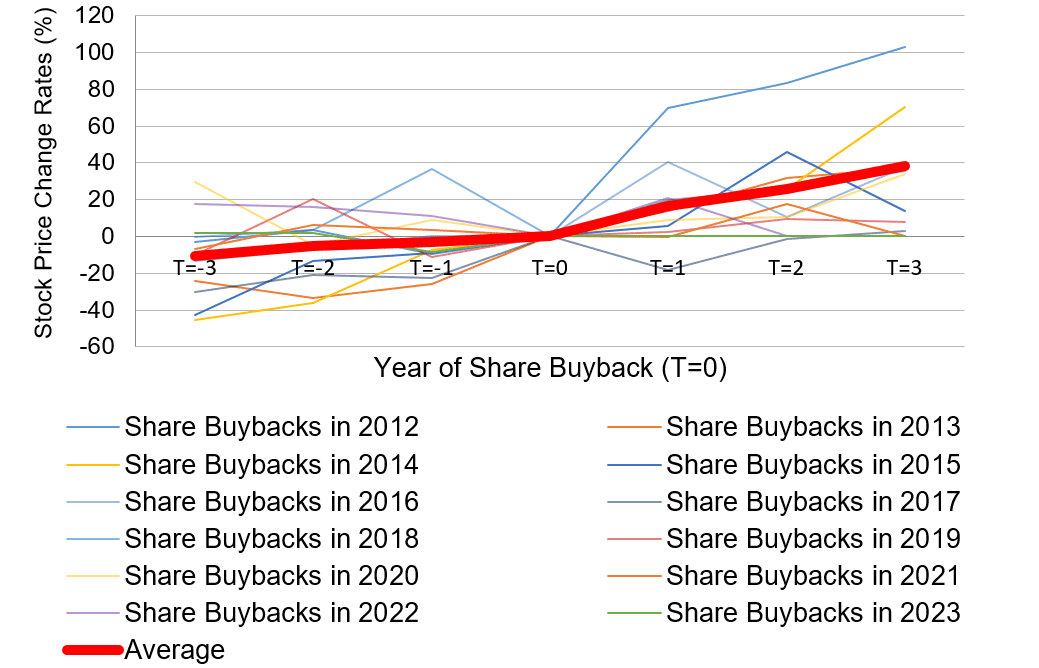
Taking a look at the average (bold red line), we can see that while stock prices are generally on an upward trend, the rate of increase is even higher starting from the year of the share buyback. This indicates that buybacks tend to increase a company’s stock price.
Evaluating Predictability of Share Buybacks
If share buybacks help increase stock prices, then investment performance could be improved by including companies that are expected to repurchase their own shares in the portfolio in advance.
Therefore, we attempted to predict buybacks using the QUICK’s Share Buybacks Data. The prediction method is as follows.
[Prediction Method]
Machine learning is performed at the end of the year to predict the probability of a buyback occurring in the following year.
- Objective variable: Probability of a share buyback occurring in the following year
- Explanatory variables: Share Buybacks Data (e.g., past buybacks), financial data (e.g., sales, equity ratio), stock prices and indices (e.g., log market capitalization), and other data provided by QUICK, aggregated as of year-end
For example, to predict a share buyback occurrence in 2024 at the end of the year 2023, the following steps would be taken: (1) Aggregate the learning data (explanatory variables) as of the end of 2023; and (2) Use machine learning to predict a buyback (the objective variable) that will take place in 2024.

Using this forecasting method, we examined the accuracy of buyback predictions each year from 2013 to 2022. We calculated the Area Under the Curve (AUC), which is used as an indicator to evaluate the model and verify its accuracy. The closer the AUC value is to 1, the more accurate the model is.
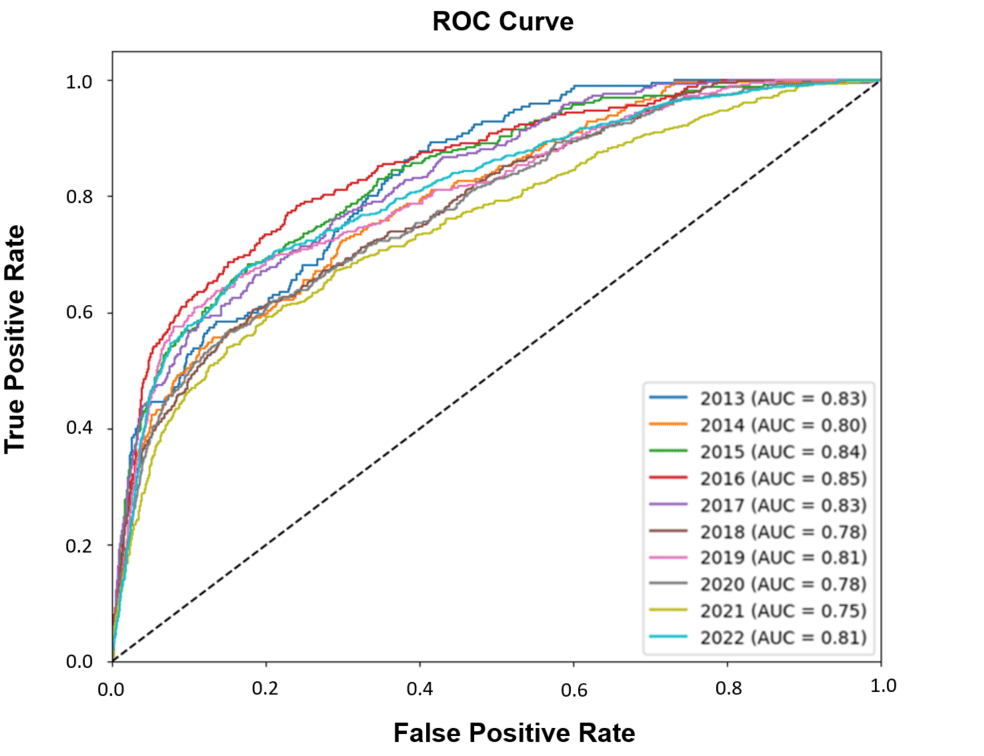
The resulting AUC values were high, averaging about 0.8 for each year. This indicates that share buybacks in the following year can be predicted with high accuracy in all years. Therefore, the past buybacks data and financial data could be used to predict future buybacks.
Investment Strategy Using Share Buybacks Data
Using the QUICK data, we found that the occurrence of share buybacks in the following year could be predicted with a high degree of accuracy. Therefore, we devised an investment strategy using the predicted probability of buyback occurrence and evaluated the performance.
The following investment strategy was examined in this study.
- [Investment Strategy]
- At the end of each year, calculate the probability that each stock covered in this study will announce a share buyback in the following year.
- Rank the target stocks according to the calculated probability of buyback occurrence, and divide them into the top, middle, and bottom groups in terms of occurrence probability.
- Purchase stocks at the end of the year in the group with the highest probability, assuming that the stock prices of companies that implement buybacks will rise.
- Sell the stocks at the end of the following year.
The following chart shows the performance based on this investment strategy (time series of cumulative excess return over TOPIX) from the end of 2012 to the end of 2022. The stocks covered were those listed on the Prime Market of the Tokyo Stock Exchange (excluding non-Japanese companies and financial companies).
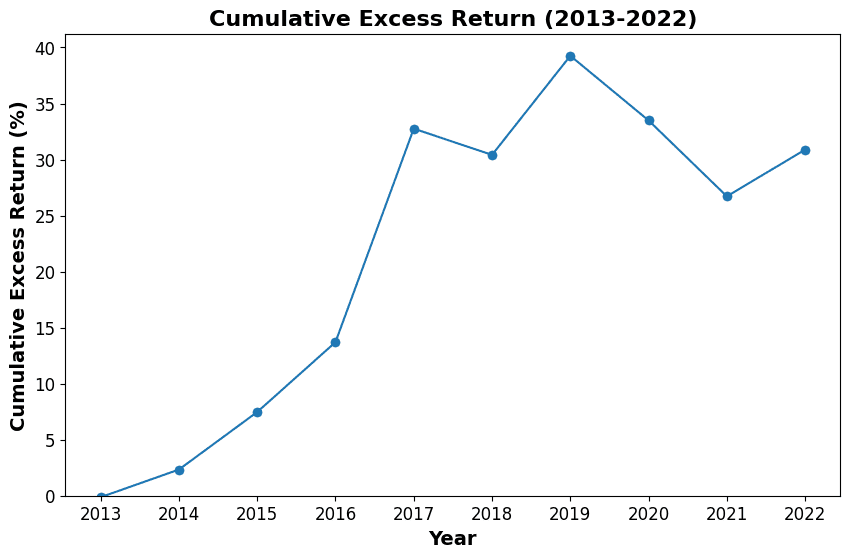
The result shows that when the portfolio was composed of stocks with a high probability of share buyback occurrence, the cumulative excess return ultimately reached about 30%, and the annualized average return remained steady at around 3%.
Usefulness of Share Buybacks Data
In this study, we evaluated the predictability of future share buybacks based on a company’s past buyback data and financial condition. The study found that buybacks can be predicted with a high degree of accuracy and that the predictions can be used for investment strategies. The Share Buybacks Data is beneficial for making investment decisions.
On the other hand, this study used a simple method of aggregating stocks with a high occurrence probability and examined their performances. There should be room for further improvement in the selection of learning data and stocks for investment. For example, some stocks don’t have a significant impact from buybacks. It may be possible to improve investment performance by identifying and excluding stocks that have a negligible effect on stock prices by share buybacks.
QUICK provides the Share Buybacks Data introduced in this case study via API. In addition to whether or not companies repurchased their own shares, which was used in this study, this dataset contains various information, such as each company’s progress in share buybacks. We highly recommend it for use in the selection of stocks.
Related Dataset:
Share Buybacks Data
https://corporate.quick.co.jp/data-factory/en/product/data029/


