Japan Markets ViewTop ETF Inflows Go to TSE REITs; Significant Outflows from Nikkei 225-Linked Funds
Dec 03, 2025

[Keiichiro Hirai, QUICK Market Eyes] According to the weekly Exchange Traded Fund (ETF) capital flow data compiled by QUICK for November 10–14, funds flowed into ETFs linked to the Tokyo Stock Exchange REIT Index and the Tokyo Stock Price Index (TOPIX). Meanwhile, capital outflows from the funds linked to the Nikkei 225 were prominent. Market participants noted, “The rapid rise of the Nikkei 225 has paused, and a rotation to other themes may be occurring.”
TSE REIT-Linked Fund Doubles
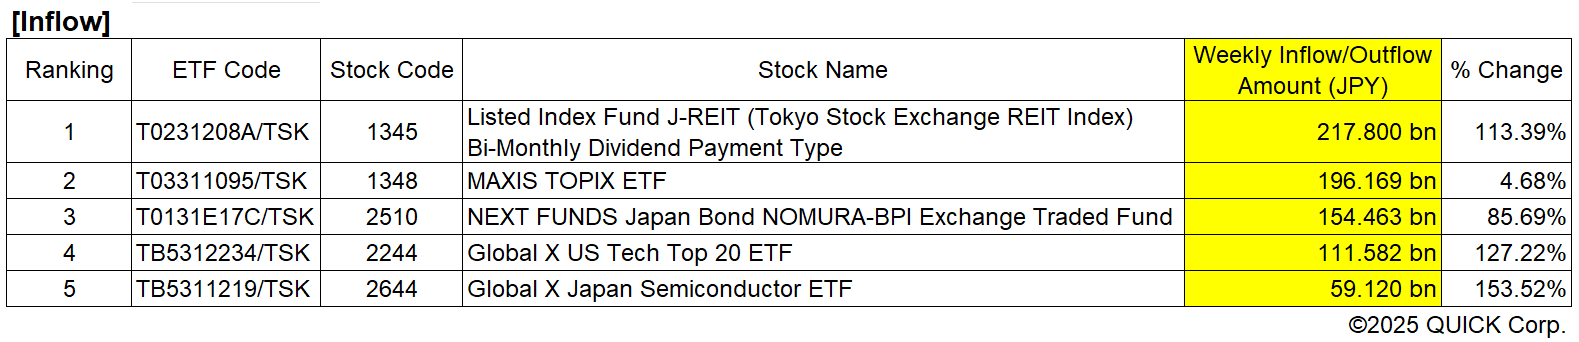
The top inflow was seen in “Listed Index Fund J-REIT (Tokyo Stock Exchange REIT Index) Bi-Monthly Dividend Payment Type” (1345, T0231208A/TSK). It increased by JPY217.80033 bn over the week. This represented a large inflow, expanding 2.1 times compared to the total net assets on the previous weekend, November 7. The Tokyo Stock Exchange REIT Index has continued an upward trend since the start of 2025. Favorable price movements may be attracting buying interest. The index updated its year high on November 17. It appears likely to continue attracting investment.
The second place was “MAXIS TOPIX ETF” (1348, T03311095/TSK), which increased by JPY196.16896 bn (4.68% of the total net assets as of November 7). The third place was “NEXT FUNDS Japan Bond NOMURA-BPI Exchange Traded Fund” (2510, T0131E17C/TSK), which grew by JPY154.46273 bn (85.69%). “Buying extended to ETFs, driven by the anticipation of higher prices for TOPIX, which rose for four consecutive days from November 10 to 13, and the sense of affordability in government bonds,” noted a strategist in Japan.
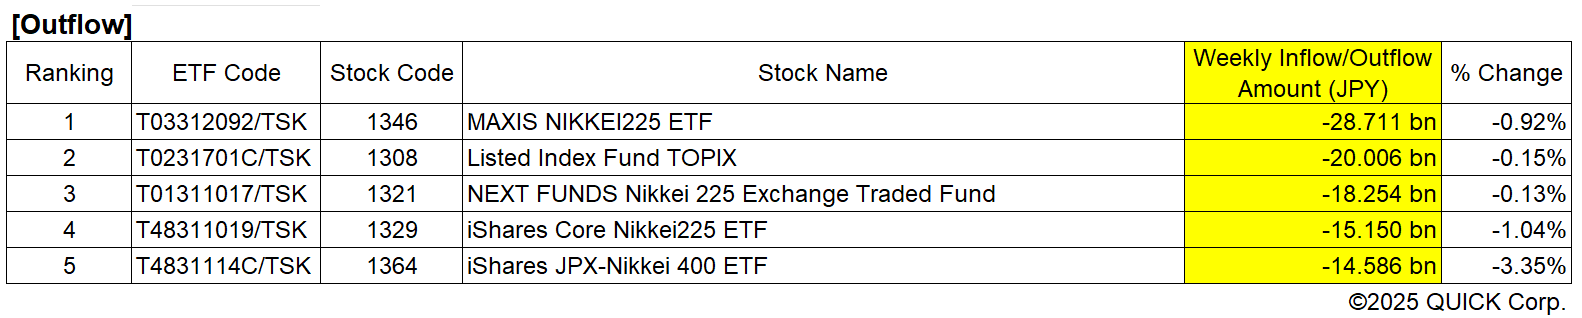
The top outflow was “MAXIS NIKKEI225 ETF” (1346, T03312092/TSK), which decreased by JPY28.71078 bn (0.92% of the total net assets as of November 7). The second place was “Listed Index Fund TOPIX” (1308, T0231701C/TSK), which shed JPY20.00641 bn (0.15%).
The third place was “NEXT FUNDS Nikkei 225 Exchange Traded Fund” (1321, T01311017/TSK), down JPY18.25376 bn (0.13%). The fourth place was also a Nikkei 225-linked fund, “iShares Core Nikkei225 ETF” (1329, T48311019/TSK), which saw a decrease of JPY15.15029 bn (1.04%).
Possible Large Inflows Due to Risk Considerations
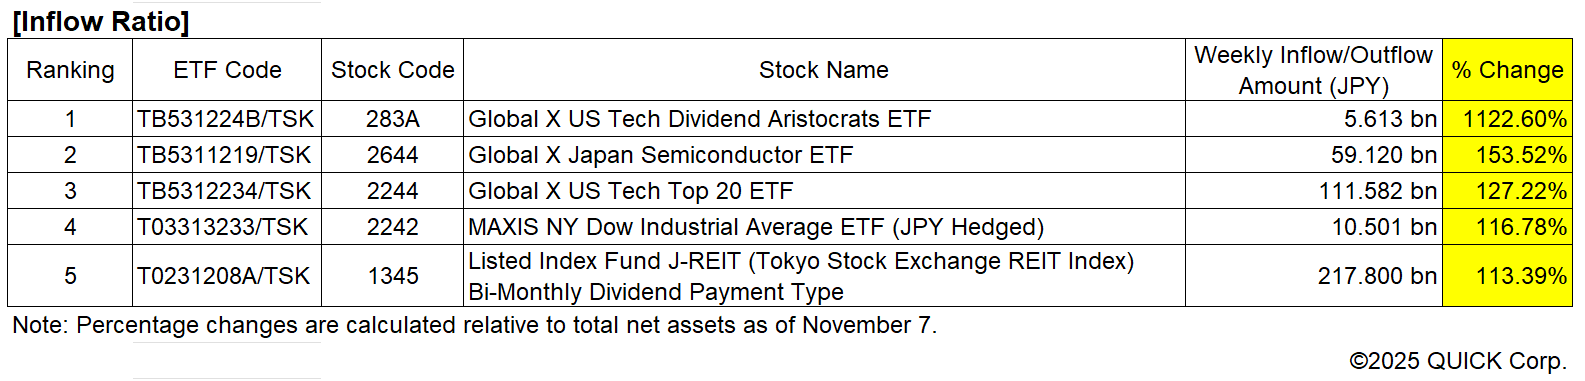
The top inflow ratio, calculated as the inflow amount relative to total net assets as of November 7, was seen in “Global X US Tech Dividend Aristocrats ETF” (283A, TB531224B/TSK). It expanded about 12.22 times (JPY5.613 bn over the week). This ETF tracks the “S&P Technology Dividend Aristocrats Index,” which consists of US tech stocks that have increased their dividends for at least seven consecutive years. Despite the sell-off in US tech stocks, risk considerations prompted investors to seek out ETFs focusing on substantial dividends.
The second place was “Global X Japan Semiconductor ETF” (2644, TB5311219/TSK), which increased about 2.53 times (JPY59.19765334 bn). The third place was “Global X US Tech Top 20 ETF” (2244, TB5312234/TSK), which grew 2.27 times (JPY111.581709139 bn).
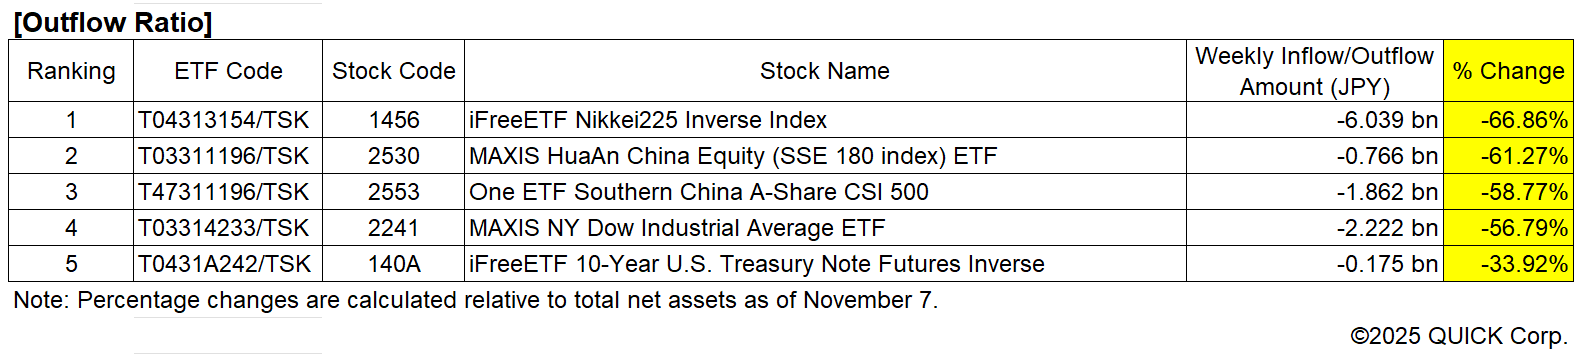
The top outflow ratio was observed in “iFreeETF Nikkei 225 Inverse Index” (1456, T04313154/TSK), which decreased by 66.86% (JPY6.038611637 bn). This ETF moves inversely to the Nikkei 225. The second place was “MAXIS HuaAn China Equity (SSE 180 index) ETF” (2530, T03311196/TSK), down 61.27% (JPY0.765851064 bn). The third place was “One ETF Southern China A-Share CSI 500” (2553, T47311196/TSK), which saw a decrease of 58.77% (JPY1.862430168 bn).
The inflow and outflow amounts were calculated using data available on QUICK’s financial terminal. Inflow/Outflow Amount = (Difference in the number of outstanding investment units from the previous day) × (NAV per unit on the previous day). NAV per unit on the previous day = (Total net assets on the previous day) ÷ (Number of outstanding investment units on the previous day).
(Reported on November 25)
Interested in Japan’s ETF data in this article?
Contact us: https://corporate.quick.co.jp/en/contact/form_service_en/
QUICK Data Factory:
Disclaimer:
MRF Balance Hovers at Record High JPY16 tn Level: QUICK Calculations
TSE Top Executive’s Regional Tour: Journey to Instill the Investor Perspective
Follow us on LinkedIn to stay updated with Japan Markets.